Visual storytelling: Differences between graphical abstracts and infographics

Are you tired of struggling to communicate complex ideas from your research paper to your audience? Do you feel like you're not getting through to them as effectively as you could? Well, fear not! There's a solution that's been proven to work time and time again: visual aids.
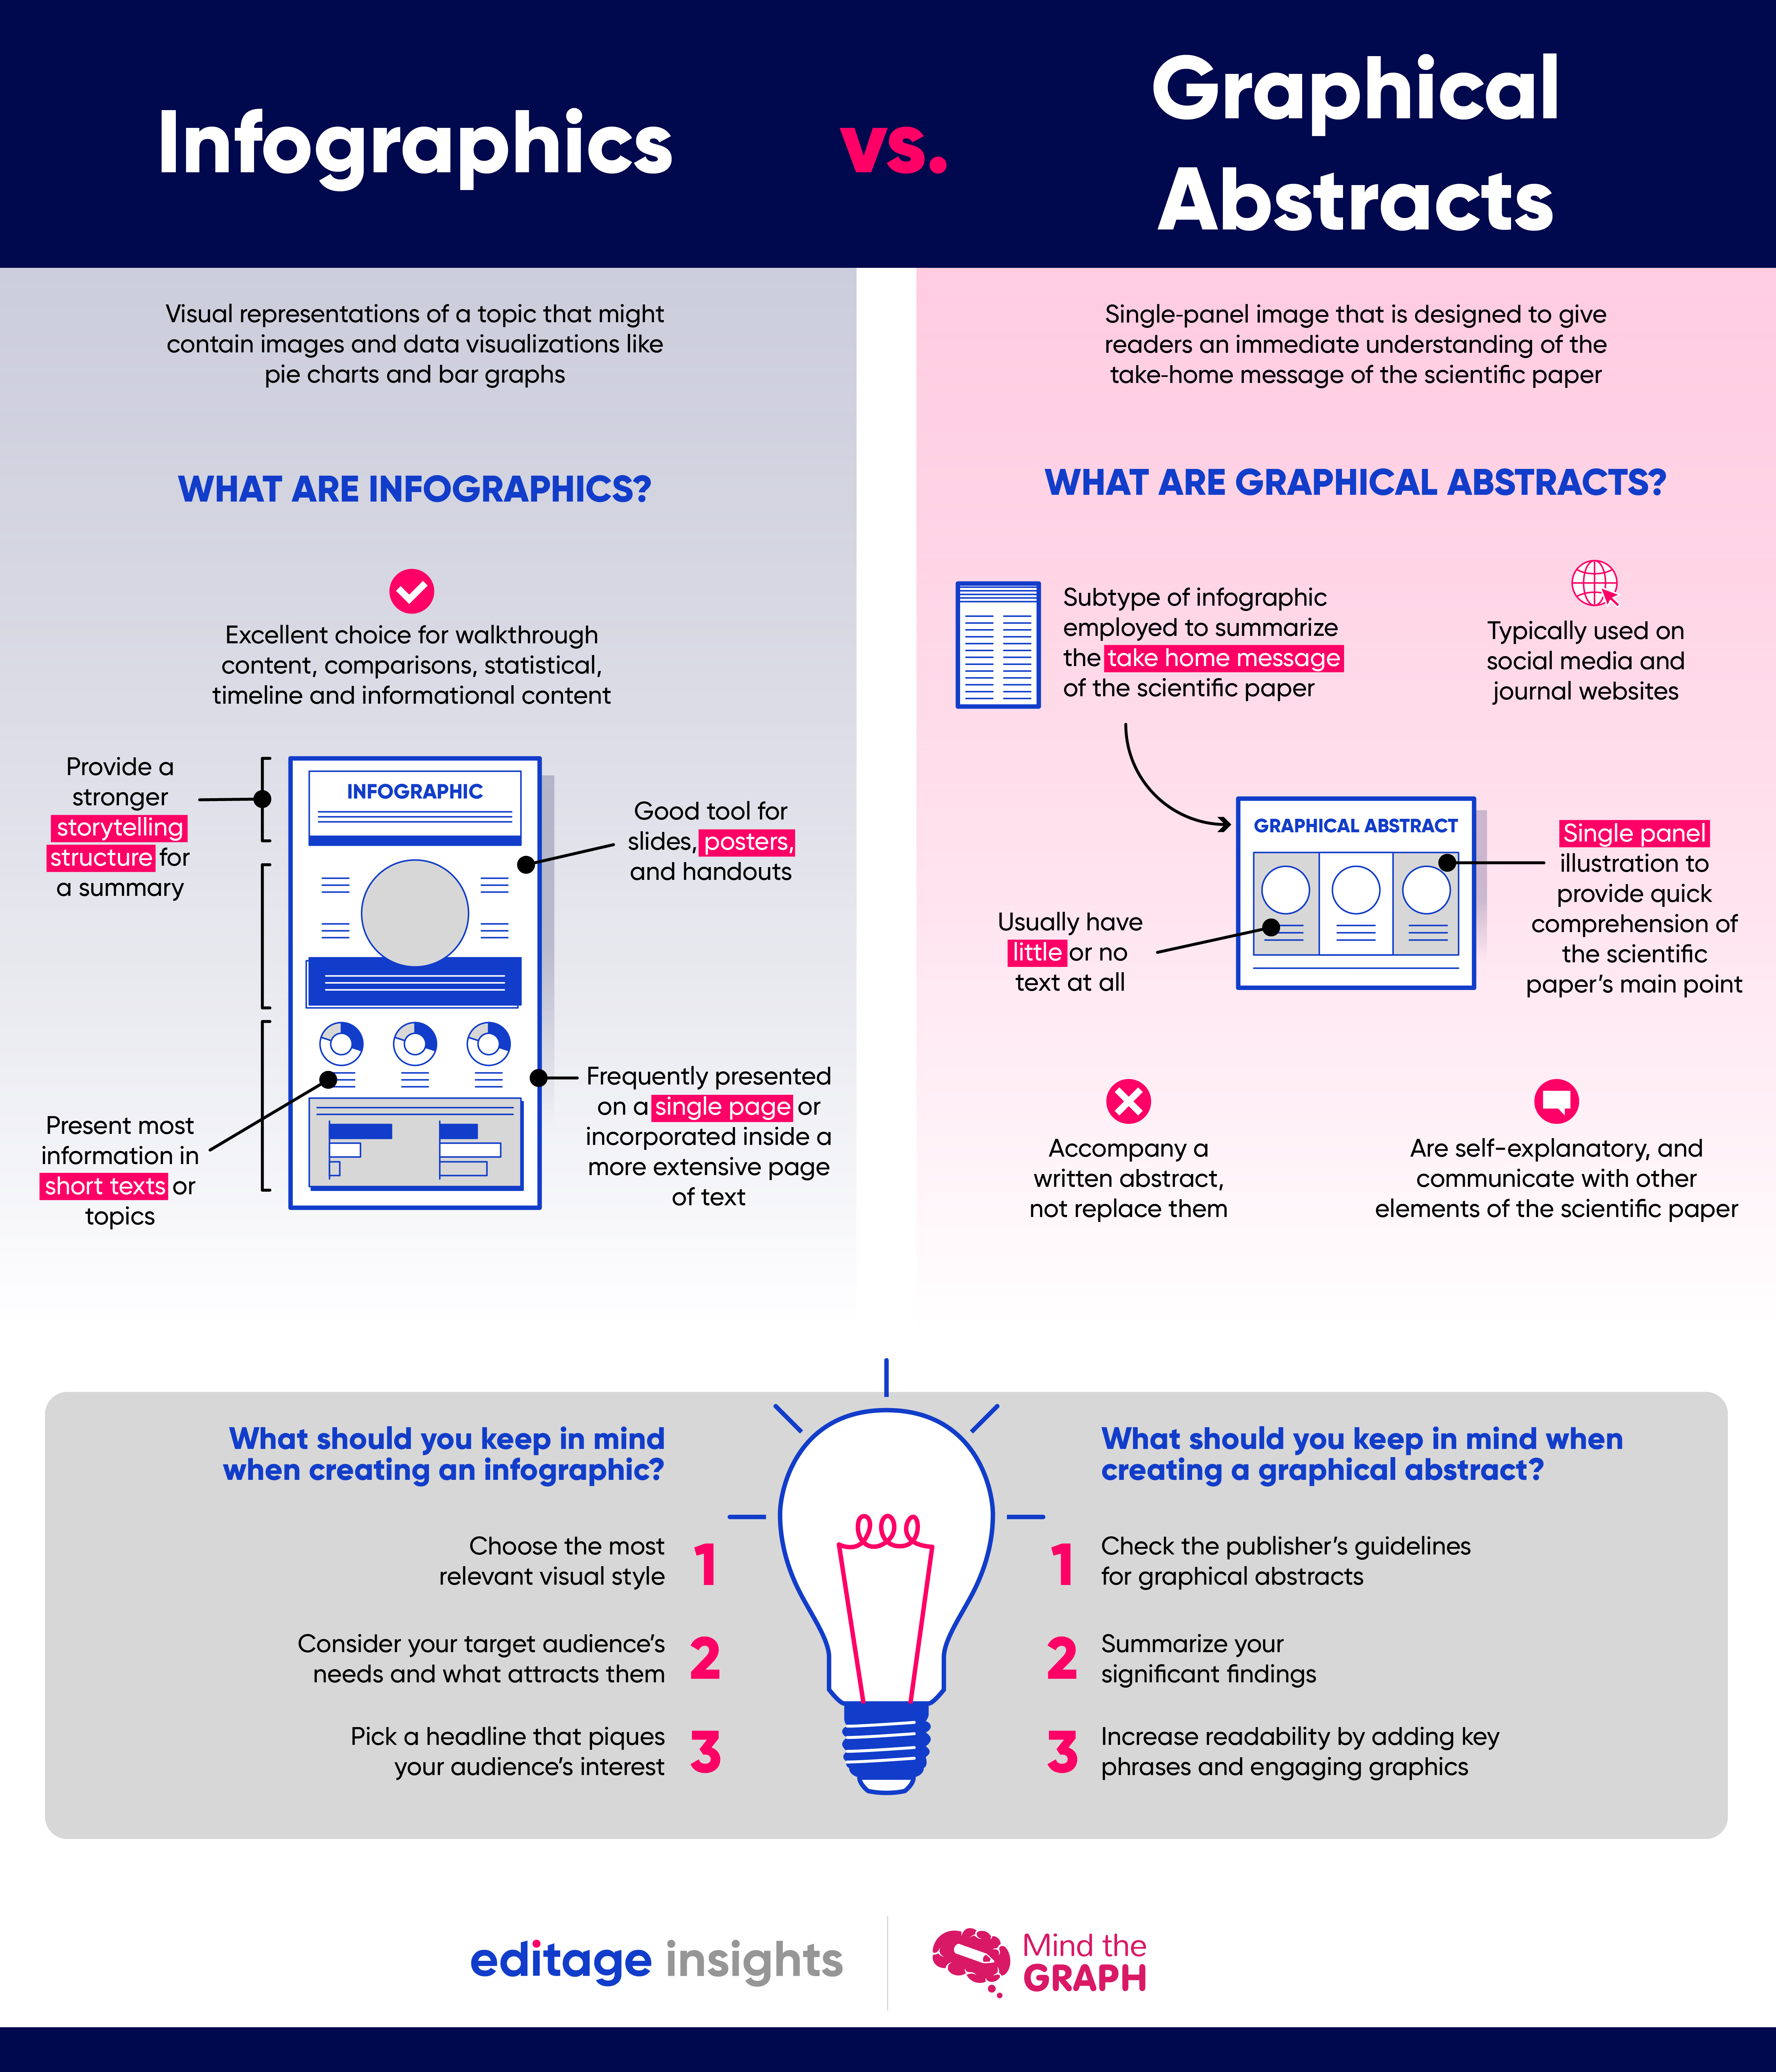
Two popular methods for visually conveying research information are infographics and graphical abstracts. Infographics are a great way to inform large audiences about social media and other digital platforms, while graphical abstracts are perfect for promoting fresh research discoveries in a variety of disciplines.
Think of them as complementary tools that can be used to achieve different goals. Infographics are perfect for providing an overview of a topic, while graphical abstracts are ideal for summarizing the main points of a research paper.
Now, the key to successful visual communication is design. That's right, it's not just about the content, but also about how it's presented. To create effective infographics and graphical abstracts, designers must consider factors such as color, typography, and layout. But don't worry, we've got you covered.
So, next time you need to explain your research, remember the power of visual aids. Whether you choose an infographic or a graphical abstract, just make sure you design it with your audience in mind, and you'll be sure to get your message across more efficiently and effectively than ever before!

Differences between graphical abstracts and infographics.jpg
You're looking to give wings to your academic career and publication journey. We like that!
Why don't we give you complete access! Create a free account and get unlimited access to all resources & a vibrant researcher community.

This content belongs to the Manuscript Writing Stage
Translate your research into a publication-worthy manuscript by understanding the nuances of academic writing. Subscribe and get curated reads that will help you write an excellent manuscript.


![INFOGRAPHIC: [Downloadable] 9 Steps to create an infographic for your… INFOGRAPHIC: [Downloadable] 9 Steps to create an infographic for your…](https://cdn.editage.com/insights/editagecom/production/styles/card_image/public/presentation-1559937_960_720%20%281%29.png?itok=hRo2wdrQ)

View Comments