|
Getting your Trinity Audio player ready...
|
TL;DR
- Use ANOVA when you simply want to compare means across groups.
- Use ANCOVA when you want to compare means while statistically controlling for another variable that could affect the outcome.
Contents
- What is ANOVA?
- What is ANCOVA?
- How to Perform an ANCOVA
- ANOVA vs ANCOVA at a glance
- How do ANOVA and ANCOVA work?
- When should you use ANOVA?
- When should you use ANCOVA?
- Understanding covariates
- ANOVA vs ANCOVA: Advantages and Limitations
- Assumptions of ANOVA vs ANCOVA
- Examples of Using ANOVA vs ANCOVA in different research fields
- ANOVA vs ANCOVA: Key differences
- Common mistakes to avoid
- How to choose between ANOVA and ANCOVA
- Frequently Asked Questions (FAQs)
- Key takeaways
What is ANOVA?
Analysis of Variance (ANOVA) is a statistical method used to determine whether the means of three or more groups differ significantly.
Instead of performing multiple t-tests—which increase the risk of Type I error—ANOVA evaluates all groups simultaneously using a single hypothesis test.
ANOVA compares:
- variation between groups
- variation within groups
If the between-group variation is sufficiently larger than the within-group variation, the differences are considered statistically significant.
Example
A researcher compares exam scores among students taught using three different teaching methods.
- Group A: Traditional lectures
- Group B: Online learning
- Group C: Flipped classroom
Independent variable
Teaching method (categorical)
Dependent variable
Exam score (continuous)
ANOVA answers the question: Do any of these teaching methods produce significantly different average scores?
What is ANCOVA?
Analysis of Covariance (ANCOVA) extends ANOVA by including one or more covariates: continuous variables that may influence the dependent variable.
Instead of comparing raw group means, ANCOVA compares adjusted means after removing the effect of the covariate. This provides a clearer estimate of the effect of the independent variable.
Example
Suppose the previous study reveals that students entered the course with different levels of prior knowledge.
Researchers measure:
- Pre-test score
- Final exam score
Here:
Independent variable
Teaching method
Dependent variable
Final exam score
Covariate
Pre-test score
ANCOVA asks: After accounting for differences in prior knowledge, do teaching methods still differ?
How to Perform an ANCOVA
Performing an ANCOVA involves more than simply adding a covariate to an ANOVA model. To obtain valid results, researchers should carefully plan the analysis, verify assumptions, and interpret the adjusted means correctly.
Step 1: Define your variables
Identify the three key variables in your study:
- Independent variable (factor): A categorical variable with two or more groups (e.g., treatment type, teaching method).
- Dependent variable: A continuous outcome (e.g., test score, blood pressure).
- Covariate: A continuous variable related to the outcome but not affected by the treatment (e.g., pre-test score, age, baseline blood pressure).
Step 2: Check ANCOVA assumptions
Before running the analysis, ensure that:
- Observations are independent.
- The dependent variable is approximately normally distributed within each group.
- Variances are similar across groups (homogeneity of variance).
- There is a linear relationship between the covariate and the dependent variable.
- The relationship between the covariate and the dependent variable is similar across groups (homogeneity of regression slopes).
- The covariate was measured before the intervention and is not influenced by the independent variable.
Violating these assumptions can lead to biased or misleading results.
Step 3: Fit the ANCOVA model
Using statistical software such as SPSS, R, SAS, Stata, or Python, specify:
- The dependent variable
- The categorical independent variable
- One or more continuous covariates
The software estimates how much of the variation in the outcome is explained by the covariate before testing whether the adjusted group means differ significantly.
Step 4: Interpret the results
Review the ANCOVA output by examining:
- The F-statistic and p-value for the independent variable to determine whether adjusted group means differ significantly.
- The significance of the covariate to assess whether it explains variation in the outcome.
- Adjusted (estimated marginal) means, which represent group means after controlling for the covariate.
- Measures of effect size (e.g., partial eta squared) and confidence intervals to evaluate the practical significance of the findings.
If the overall ANCOVA is significant and your independent variable has more than two groups, conduct appropriate post hoc comparisons using the adjusted means to identify which groups differ while controlling for multiple comparisons.
ANOVA vs ANCOVA at a glance
| Feature | ANOVA | ANCOVA |
| Full name | Analysis of Variance | Analysis of Covariance |
| Primary purpose | Compare group means | Compare adjusted group means |
| Controls for covariates | No | Yes |
| Independent variable | Categorical | Categorical |
| Covariate | None | Continuous |
| Dependent variable | Continuous | Continuous |
| Removes confounding effects | No | Yes |
| Statistical power | Lower | Often higher |
| Complexity | Moderate | Higher |
How do ANOVA and ANCOVA work?
ANOVA
ANOVA divides total variability into:
- Between-group variability
- Within-group variability
It calculates an F-statistic:
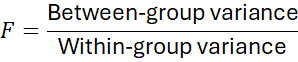
A large F-value suggests that group differences are unlikely to be due to chance.
ANCOVA
ANCOVA first fits a regression model to explain how the covariate influences the dependent variable.
It then removes this influence before comparing groups.
Conceptually:
Observed score
↓
Remove variation explained by covariate
↓
Compare adjusted scores across groups
This produces adjusted means that better reflect the true treatment effect.
When should you use ANOVA?
Use ANOVA when:
- comparing three or more independent groups
- no important continuous confounders exist
- randomization has produced similar groups
- baseline measurements are unavailable
- the research question focuses on mean differences
Examples include:
| Research question | Appropriate? |
| Do three fertilizers produce different crop yields? | ✓ |
| Do four diets affect cholesterol differently? | ✓ |
| Do five advertising campaigns generate different sales? | ✓ |
See also: ANOVA vs MANOVA
When should you use ANCOVA?
ANCOVA is appropriate when:
- important baseline differences exist
- a continuous variable affects the outcome
- researchers wish to reduce unexplained variability
- the covariate is measured before treatment
Examples include:
| Study | Covariate |
| Drug effectiveness | Baseline blood pressure |
| Educational intervention | Pre-test score |
| Weight-loss program | Initial body weight |
| Clinical trial | Age |
| Cognitive training | IQ score |
Understanding covariates
A covariate is a variable that:
- influences the dependent variable
- is not the primary variable of interest
- may introduce unwanted variability
Examples include:
| Study | Covariate |
| Exercise program | Initial fitness level |
| Reading intervention | Reading ability before treatment |
| Medication trial | Age |
| Agricultural experiment | Soil fertility |
| Psychology experiment | Baseline anxiety score |
By controlling these variables, ANCOVA produces cleaner comparisons.
Worked example
Suppose researchers compare three study techniques.
ANOVA results
| Group | Average score |
| Flashcards | 80 |
| Videos | 85 |
| Practice tests | 89 |
ANOVA concludes that scores differ significantly.
However, students using practice tests had much higher prior GPA.
ANCOVA results
After adjusting for GPA:
| Group | Adjusted mean |
| Flashcards | 84 |
| Videos | 85 |
| Practice tests | 86 |
The difference becomes much smaller.
This suggests part of the observed difference was due to prior academic ability rather than study technique itself.
ANOVA vs ANCOVA: Advantages and Limitations
Advantages of ANOVA
- Easy to interpret
- Widely used
- Appropriate for randomized experiments
- Controls Type I error better than multiple t-tests
- Foundation for many advanced statistical methods
Advantages of ANCOVA
- Controls confounding variables
- Reduces error variance
- Improves statistical power
- Produces adjusted group means
- Often detects treatment effects more accurately
Limitations of ANOVA
- Cannot adjust for baseline differences
- Sensitive to outliers
- Assumes equal variances
- Requires independence of observations
- Less efficient when important covariates exist
Limitations of ANCOVA
- More assumptions
- Covariates must be measured accurately
- Covariates should not be affected by treatment
- Interpretation is more complex
- Incorrect covariates can bias results
Assumptions of ANOVA vs ANCOVA
| Assumption | ANOVA | ANCOVA |
| Independent observations | ✓ | ✓ |
| Normally distributed residuals | ✓ | ✓ |
| Homogeneity of variance | ✓ | ✓ |
| Continuous dependent variable | ✓ | ✓ |
| Linear relationship with covariate | — | ✓ |
| Homogeneity of regression slopes | — | ✓ |
| Covariate measured without substantial error | — | ✓ |
Examples of Using ANOVA vs ANCOVA in different research fields
Biomedical research
ANOVA
Compare mean blood glucose across treatment groups.
ANCOVA
Compare blood glucose while adjusting for baseline glucose level.
Psychology
ANOVA
Compare anxiety scores across therapy types.
ANCOVA
Adjust anxiety scores for baseline anxiety.
Education
ANOVA
Compare average mathematics scores across teaching methods.
ANCOVA
Adjust for prior mathematics achievement.
Agriculture
ANOVA
Compare crop yield across fertilizer types.
ANCOVA
Adjust yield for rainfall or soil nutrient levels.
Marketing
ANOVA
Compare customer spending across advertising campaigns.
ANCOVA
Adjust spending for previous purchase history.
ANOVA vs ANCOVA: Key differences
| Aspect | ANOVA | ANCOVA |
| Goal | Compare means | Compare adjusted means |
| Covariates | None | Included |
| Precision | Moderate | Higher |
| Handles confounding | No | Yes |
| Statistical power | Moderate | Often greater |
| Interpretation | Simpler | More nuanced |
Common mistakes to avoid
Ignoring important baseline variables
If groups differ substantially before treatment, ANOVA may attribute those differences to the intervention. Consider ANCOVA when a meaningful pre-existing continuous variable influences the outcome.
Using a treatment-affected variable as a covariate
A valid covariate should be measured before the intervention and should not itself be influenced by the treatment. Adjusting for a post-treatment variable can introduce bias.
Violating the homogeneity of regression slopes assumption
ANCOVA assumes the relationship between the covariate and the outcome is similar across groups. If the slopes differ, the standard ANCOVA model may not be appropriate.
Including unnecessary covariates
Adding variables that are weakly related to the outcome or highly correlated with each other can reduce interpretability and may not improve the analysis.
Forgetting post hoc tests
A significant ANOVA or ANCOVA indicates that at least one group differs from the others, but it does not identify which groups differ. Appropriate post hoc comparisons are often needed.
How to choose between ANOVA and ANCOVA
| If your study… | Use |
| Compares group means only | ANOVA |
| Has baseline measurements | ANCOVA |
| Includes continuous confounders | ANCOVA |
| Uses randomized groups with similar baseline characteristics | ANOVA |
| Needs greater statistical precision | ANCOVA |
Frequently Asked Questions (FAQs)
Is ANCOVA better than ANOVA?
Not necessarily. ANCOVA is advantageous when there are relevant continuous covariates that should be controlled. If no meaningful covariates exist, ANOVA is simpler and appropriate.
Can ANCOVA increase statistical power?
Yes. By removing variability explained by covariates, ANCOVA often reduces error variance, making it easier to detect true group differences.
What is an adjusted mean?
An adjusted mean is the estimated group mean after statistically controlling for the influence of one or more covariates. It represents what the group mean would be if all groups had the same average covariate value.
Can ANCOVA include multiple covariates?
Yes. Researchers can include several continuous covariates, provided the sample size is adequate and the assumptions of the model are met.
What if the covariate interacts with the treatment?
If the relationship between the covariate and the outcome differs across groups (i.e., there is an interaction), the assumption of homogeneous regression slopes is violated. In such cases, an interaction model or another analytical approach may be more appropriate.
Is ANCOVA the same as multiple regression?
They are closely related. ANCOVA is a special case of the general linear model that combines features of ANOVA (categorical predictors) and linear regression (continuous predictors).
Can I use ANCOVA with only two groups?
Yes. ANCOVA can compare two or more groups while adjusting for continuous covariates. With two groups, it can be viewed as an extension of the independent-samples t-test that controls for additional variables.
Key takeaways
- ANOVA compares the means of two or more groups without accounting for other continuous variables.
- ANCOVA compares group means after adjusting for one or more continuous covariates.
- ANCOVA can improve precision and statistical power by reducing unexplained variability, but it requires additional assumptions.
- Choosing between ANOVA and ANCOVA depends on your research question, study design, and whether relevant baseline or confounding variables need to be controlled.
- Both methods are fundamental tools for analyzing continuous outcomes and are widely used across biomedical, social science, education, agriculture, and business research.


Comment