
Key Takeaways
- Use a table when readers need exact values and precise comparisons; use a figure when the pattern, trend, or shape of the data matters more than the individual numbers.
- Every table must stand alone: a clear numbered title, informative column headings with units, and notes that define all abbreviations should let a reader understand the table without reading the surrounding text.
- Follow your target journal’s style guide for borders, note order, and numbering; most academic styles use only horizontal lines and prohibit vertical rules, shading, and color.
- Move large, granular, or secondary datasets to appendices or supplementary files, and keep only the tables that directly support your main argument in the body of the paper.
Contents
- Glossary of Key Terms
- Why Do Tables Matter in a Research Paper?
- Should You Use a Table or a Figure?
- Planning Your Tables Before You Build Them
- Table Titles and Numbering
- Designing Column Headings and Row Labels
- Table Notes: The Fine Print That Makes Tables Stand Alone
- Table Formatting Rules That Journals Expect
- How Do the Major Style Guides Differ on Tables?
- Tables for Supplementary Data and Appendices
- Referring to Tables in the Text
- Accessibility and Reproducibility Considerations
- Common Table Mistakes and How to Fix Them
- Pre-Submission Table Checklist
- Frequently Asked Questions
Glossary of Key Terms
Here are the technical terms used throughout this guide. Table anatomy has its own vocabulary, and knowing it makes style guide instructions much easier to follow.
| Term | Definition |
| Stub / stub column | The leftmost column of a table, holding the labels that identify each row. |
| Stub head | The heading at the top of the stub column, describing what the row labels represent. |
| Column heading | The label at the top of a data column that tells readers what the values below it are. |
| Spanner heading (decked head) | A heading that sits above and spans two or more column headings, grouping them under one category. |
| Body | All the cells containing data, excluding headings, the stub, and notes. |
| General note | A note applying to the whole table, such as the source or abbreviation definitions. |
| Specific note | A note tied to one cell, row, or column, marked with a superscript letter or symbol. |
| Probability (significance) note | A note defining significance markers such as asterisks, for example *p < .05. |
| Callout / in-text citation of a table | The sentence in the text that points readers to the table, such as ‘see Table 2.’ |
| Supplementary table | A table published in an appendix or an online supplement rather than in the body of the paper. |
Why Do Tables Matter in a Research Paper?
Tables matter in a research paper because they present exact values in a compact, scannable structure that prose cannot match, and because reviewers and readers routinely judge the rigor of a paper by the clarity of its tables. A paragraph describing twelve group means is nearly unreadable; the same information in a 4-column table takes seconds to absorb.
Good tables serve three audiences at once: skimming readers who extract your main results without reading the full text, careful readers who verify the claims in your Results section, and reviewers or meta-analysts who check and later reuse your data. If any of these groups cannot interpret a table without hunting through the manuscript, the table has failed.
Tables also carry an editorial cost: journals limit display items, and badly formatted tables are among the most common reasons manuscripts are returned for technical revision before review even begins.
Should You Use a Table or a Figure?
Use a table when readers need precise numerical values, exact comparisons across many variables, or text-based information; use a figure when the visual pattern, trend, distribution, or relationship is the message. Making this decision early prevents wasted work.
A practical test: write the sentence the display item must support. If it contains words like ‘increased’ or ‘correlated,’ a figure will communicate faster; if it contains specific quantities readers may want to cite, choose a table.
| Criterion | Choose a Table | Choose a Figure |
| Reader’s need | Exact values, precise comparisons | Overall pattern, trend, or shape |
| Type of data | Many variables, mixed units, text entries | Continuous data, time series, distributions |
| Typical content | Descriptive statistics, regression output, sample characteristics | Growth curves, scatterplots, flow diagrams, images |
| Volume of data | Moderate: readers must scan every cell | Large: thousands of points compress into one plot |
Never duplicate: presenting the same data as both a table and a figure is prohibited by virtually every journal, and the text should highlight only the key numbers rather than repeating the table. If a dataset can be stated in one or two sentences, use neither; a display item with three or four values wastes space.
Planning Your Tables Before You Build Them
The best tables are designed before the manuscript is drafted, not bolted on afterward. Start by listing the claims your Results section must support, then decide which claims need a display item, and only then decide what each table must contain. This claim-first approach keeps every table purposeful.
How Many Tables Should a Research Paper Have?
Most original research articles work well with 3 to 5 tables, and many journals cap total display items (tables plus figures) at 5 to 8, so check the author guidelines before you build anything. Typical allocations in an empirical paper look like this:
- Table 1: sample or study characteristics.
- Table 2: main results, such as the primary model or outcome comparison.
- Table 3: secondary analyses, subgroup results, or robustness checks.
- Additional tables only if they support a distinct claim that cannot be merged into an existing table.
Planning eight or more tables is a signal to consolidate, convert pattern-focused tables into figures, or move granular material to the supplement.
Deciding What Belongs in Each Table
Each table should answer exactly one question; a table that mixes demographics with regression coefficients satisfies no one. When sketching a table, decide:
- The comparison of interest: this usually runs across columns, because readers compare left to right more easily than top to bottom.
- The organizing variable for rows: outcomes, predictors, items, or subgroups, ordered by a logic the reader can detect (magnitude, chronology, importance, or a standard sequence), not by the order your software produced them.
- The statistics to report per cell: mean and standard deviation, coefficient and confidence interval, count and percentage. Report companions together, as in ‘12.4 (3.1)’ with the format defined in a note.
- What to leave out: raw data and any column whose values are constant or derivable from other columns.
Table Titles and Numbering
What Makes a Good Table Title?
A good table title is a brief, specific noun phrase that tells readers what the table shows, about whom or what, and often when or where, without interpreting the results. Aim for one line, roughly 8-15 words, in title case or sentence case depending on your style guide.
A useful template is: [Statistics or content] of [variables] by [grouping variable], [population], [time or place]. Compare the following:
- Too vague: ‘Results.’ The reader learns nothing about content.
- Too detailed: ‘Means, standard deviations, ranges, skewness, and kurtosis for all 24 items across three time points.’ That detail belongs in the headings.
- Effective: ‘Descriptive Statistics for Study Variables by Treatment Group.’ Specific, compact, and self-explanatory.
Numbering Conventions
- Number tables with Arabic numerals (Table 1, Table 2) in the exact order they are first mentioned in the text. A table cannot be numbered 3 if it is called out before Table 2.
- Tables and figures use separate numbering sequences: you can have both a Table 1 and a Figure 1.
- Appendix and supplementary tables use a distinct scheme, commonly Table A1, Table B1, or Table S1, so readers immediately know where to find them.
- In APA style, the bold label ‘Table 1’ and the italic title sit on separate lines; many medical and engineering styles put both on one line above the table.
Designing Column Headings and Row Labels
Headings are the interface of your table: readers decode every cell through them. The goal is that each column heading, combined with the row label, fully identifies the value in the cell, including its unit of measurement.
Column Headings
- Keep headings short, ideally one to three words, and put explanatory detail in a note instead of the heading.
- Always state units, either in the heading, for example ‘Weight (kg)’ or ‘Income (US$1,000s)’, or once in a general note if a single unit applies to the whole table.
- Define any nonstandard abbreviations in the notes.
- Every column needs a heading, including the stub column. A blank corner cell above the row labels is a common error.
- Keep headings parallel in grammar and capitalization: if one heading is ‘Baseline score,’ its neighbor should be ‘Follow-up score,’ not ‘Scores at Follow-Up.’
Row Labels: The Stub Column
- Left-align row labels and give the stub a heading that names the row variable, such as ‘Characteristic,’ ‘Predictor,’ or ‘Outcome.’
- Use indentation to show hierarchy: a category label such as ‘Education’ sits flush left, with subcategories like ‘High school or less’ indented beneath it. Indentation replaces repeated wording.
- Order rows meaningfully: by effect size, alphabet, chronology, or convention such as demographics before clinical variables.
- Avoid repeating the same word down a column; if every row label starts with ‘Mean score on,’ move that phrase into the stub head or title.
Spanner Headings and Decked Heads
When several columns belong to one group, place a spanner heading above them, for example ‘Intervention group’ spanning its M and SD columns. Two rules keep spanners readable:
- Limit the hierarchy to two levels (one spanner row above one heading row). Three stacked levels of headings are a sign the table should be split.
- Make the span visually unambiguous, usually with a short horizontal rule under the spanner that covers only its columns.
Example
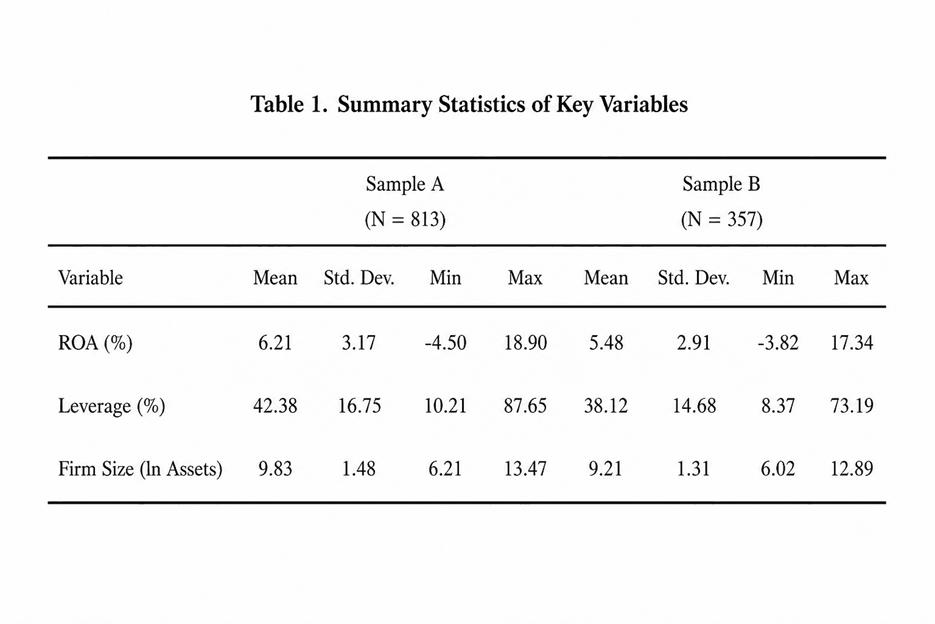
Table Notes: The Fine Print That Makes Tables Stand Alone
Notes appear directly below the table and carry everything a reader needs that does not fit in the title or headings. Most academic styles recognize three kinds of notes in a fixed order: general, then specific, then probability, each starting on a new line.
General Notes
A general note applies to the whole table. It begins with the italicized word ‘Note.’ followed by a period, and typically contains, in this order:
- Context the whole table needs, such as the sample (‘N = 412 undergraduates’) or data collection period.
- Definitions of all abbreviations used anywhere in the table, for example ‘CI = confidence interval; SD = standard deviation.’
- Explanations of formatting conventions, such as ‘Values are means with standard deviations in parentheses.’
- Source and copyright attribution if the table is reproduced or adapted from another work.
Specific Notes
A specific note refers to one column, row, or cell. Mark the location with a superscript lowercase letter (a, b, c) and repeat the letter before the note text below the table. Assign letters in reading order: left to right across the headings, then left to right and top to bottom through the body. Typical uses include ‘n = 38 due to missing data’ attached to one cell or a clarification for a single column.
Probability Notes
Probability notes define significance markers. The near-universal convention is one asterisk for p < .05, two for p < .01, and three for p < .001, written as: *p < .05. **p < .01. ***p < .001. Two cautions apply:
- Be consistent across every table in the paper; do not let * mean .05 in Table 2 and .10 in Table 3. If you must mark a .10 threshold, use a different symbol such as a dagger and define it.
- Many journals now prefer exact p values in a dedicated column, which makes asterisks redundant.
| Note Type | Marker | Typical Content |
| General | Note. (italicized) | Sample description, abbreviation definitions, formatting conventions, source attribution |
| Specific | Superscript letters a, b, c | Facts about one cell, row, or column, such as deviations in sample size |
| Probability | Asterisks or symbols | Significance thresholds, one-tailed vs two-tailed tests |
Table Formatting Rules That Journals Expect
Formatting is where most technical revisions happen. The safest default across disciplines is a minimal, monochrome table with three or four horizontal rules and nothing decorative.
Borders and Lines
- Use only three or four main horizontal rules: one above the column headings, one below the column headings, and one below the last data row. Short rules under spanner headings are also allowed.
- Do not use vertical lines. Nearly every academic style (APA, AMA, Chicago, most journal house styles) prohibits them; spacing and alignment should separate columns instead.
- Do not add gridlines around every cell. Fully boxed tables look like spreadsheets and will be reformatted by the typesetter.
- Avoid shading, fill colors, and colored text entirely; tables must survive grayscale printing, and many journals simply forbid color in tables.
Alignment, Spacing, and Layout
- Left-align text columns and the stub; center or decimal-align numeric columns so digits line up.
- Align numbers on the decimal point and report a consistent number of decimal places within each column.
- Build every table with your word processor’s table tool (Insert > Table in MS Word), never with spaces or tabs, because tabbed ‘tables’ collapse during typesetting.
- Keep each table on one page where possible. If a table must continue, repeat the header row on the next page (in Word: Table Properties > Row > ‘Repeat as header row at the top of each page’).
- Orient wide tables in landscape rather than shrinking the font, or swap rows and columns to narrow the table.
Fonts, Text, and Empty Cells
- Use the same font family as the body text, typically at the same size or one to two points smaller; notes may be smaller than the body of the table.
- Use sentence case for column headings unless your style guide says otherwise, and avoid bold or italics in the body except where required, such as italic statistical symbols (p, M, SD).
- Never leave a cell truly blank. Use a dash or the abbreviation NA and define it in a general note, for example ‘NA = not applicable.’ A blank cell is ambiguous: readers cannot tell missing data from zero from oversight.
How Many Decimal Places Should You Report?
Report as many decimal places as the precision of measurement justifies, and no more; for most behavioral and biomedical statistics that means one or two decimals. The conventions below are widely accepted:
| Statistic | Typical Precision | Example |
| Percentages | 0-1 decimal places | 42% or 41.7% |
| Means and SDs | 1-2 decimals, matching measurement precision | 12.4 (3.12) |
| Correlations, standardized betas | 2 decimals | .47 |
| Exact p values | 2-3 decimals; report p < .001 below that | p = .032 |
| Test statistics (t, F, chi-square) | 2 decimals | F = 6.21 |
How Do the Major Style Guides Differ on Tables?
The core differences concern where the title sits, how notes are labeled, and how sources are credited; the minimal three-rule, no-vertical-lines layout is common to all of them. The target journal’s author guidelines always override the general manual.
| Feature | APA (7th ed.) | AMA (Medical) | Chicago / Turabian |
| Title placement | Bold ‘Table 1’ line, italic title on next line, above table | Number and title in one line above the table | ‘Table 1.’ followed by title above the table |
| Notes label | Note. (italic), then specific, then probability notes | Footnotes with superscript letters; abbreviations note first | Unlabeled source line and notes below the table |
| Source credit | In the general note with copyright statement | In a footnote below the table | ‘Source:’ line below the table |
| Vertical rules | Not permitted | Not permitted | Discouraged |
Build tables in a style-neutral way (minimal rules, clean headings, complete notes) so converting between styles means relabeling rather than rebuilding, and when a journal supplies a sample table, imitate it exactly.
Tables for Supplementary Data and Appendices
Not every table earns a place in the body of the paper. Appendices (printed with the article) and online supplements (hosted separately) let the main text stay focused while the full evidentiary record remains available.
When Should a Table Go to the Appendix or Supplement?
Move a table out of the main text when it supports transparency rather than the paper’s central argument: if a careful reader could follow every claim without it, it belongs in the supplement. Common candidates include:
- Full item-level statistics for questionnaires when the text only discusses scale totals.
- Complete regression output for robustness checks, alternative specifications, or sensitivity analyses summarized in one sentence of the Results.
- Large correlation matrices, long lists of included studies in a review, detailed search strategies, and instrument wording.
- Raw or minimally processed data tables provided for reproducibility.
Conversely, keep in the main text any table the average reader must consult to evaluate your conclusions, especially the sample characteristics table and the primary results table.
Formatting and Citing Supplementary Tables
- Number them in their own sequence: Table A1, A2 for Appendix A, Table B1 for Appendix B, or Table S1, S2 for online supplements, following the journal’s convention.
- Hold supplementary tables to the same standard as main-text tables: full titles, defined abbreviations, and complete notes. Supplements are often published without copyediting, so errors you leave in will appear in print.
- Cite every supplementary table at least once in the main text, for example ‘Item-level statistics appear in Table S1.’ An uncited supplementary table will usually be removed.
- Check the journal’s file requirements: some want supplements merged into one PDF, others want separate editable files.
Referring to Tables in the Text
Every table must be called out in the text near where it appears, and the callout should tell readers why to look: ‘The groups differed on all three outcomes (Table 2)’ beats ‘Table 2 shows the results.’ Follow these conventions:
- Refer to tables by number (‘as shown in Table 3’), never by position (‘the table below’), because typesetting can move tables.
- Interpret, do not repeat: the text should point out the two or three values that matter and explain what they mean, leaving the remaining values to the table.
- Call tables out in numerical order; if Table 4 is mentioned before Table 3, renumber them.
- In the submitted manuscript, place each table where the journal wants it: many journals ask for tables after the references, one per page, with a placement marker such as ‘[Table 1 near here]’ in the text.
Accessibility and Reproducibility Considerations
Modern publishing adds two requirements that older guides ignore. First, accessibility: screen readers navigate real table structures, so tables must be genuine Word tables with a designated header row, never screenshots or tab-aligned text, and should avoid merged cells where possible.
Second, reproducibility: journals increasingly expect table values to be traceable to your analysis. Generating tables directly from analysis scripts, or keeping a documented mapping between output files and table cells, prevents transcription errors; before submission, have a coauthor spot-check a sample of cells against the original output.
Common Table Mistakes and How to Fix Them
Reviewers see the same table problems again and again. The list below pairs each frequent mistake with its remedy so you can audit your own drafts.
| Mistake | Why It Hurts | Fix |
| Table duplicates the text or a figure | Wastes display items; journals prohibit it | Keep one presentation; summarize the rest |
| Vertical lines and full gridlines | Violates nearly all style guides | Use 3-4 horizontal rules only unless your journal asks for more |
| Undefined abbreviations | Table cannot stand alone | Define every abbreviation in a general note |
| Missing units | Values are uninterpretable | Add units to headings or a general note |
| Inconsistent decimals | Looks careless; hinders comparison | Fix precision per column and align decimals |
| Blank cells | Ambiguous: zero, missing, or error? | Use NA or a dash and define it in a note |
| Table built with tabs or as an image | Breaks typesetting and accessibility | Rebuild with the word processor’s table tool |
Pre-Submission Table Checklist
Run every table through this checklist before you upload the manuscript:
- Numbered in order of first mention, with a specific, non-interpretive title.
- Every column, including the stub, has a heading; units are stated; abbreviations are defined.
- Notes appear in the correct order: general, specific, probability; superscript letters run left to right, top to bottom.
- Only horizontal rules; no vertical lines, shading, or color; font matches the manuscript.
- Numbers are decimal-aligned with consistent precision; no truly empty cells.
- Each table is called out in the text, adds something the text does not repeat, and could be understood by a reader who saw it in isolation.
- Values have been checked against the original statistical output, and formatting matches the target journal’s guidelines.
Frequently Asked Questions
How do you make a table in APA format in Word?
Insert a real table (Insert > Table), then apply APA conventions manually: type ‘Table 1’ in bold above the table, the italic title on the next line, remove all vertical borders, keep horizontal rules only above the headings, below the headings, and below the last row, and add a ‘Note.’ line beneath the table. Word’s built-in table styles do not match APA, so start from a plain grid and strip the borders yourself.
What is the difference between a table and a figure in a research paper?
A table arranges exact values or text in rows and columns; a figure is any other visual display, including graphs, charts, diagrams, maps, and photographs. Use a table when precise numbers matter and a figure when the pattern or relationship matters. The two are numbered separately, and the same data should never appear in both.
Do tables go before or after references in a manuscript?
It depends on the journal. Many submission formats, including traditional APA manuscripts, place each table on its own page after the reference list, with a placement marker in the text; other journals embed tables near their first mention. Follow the target journal’s author guidelines rather than a general rule.
How do you cite a table from another source in your own paper?
Credit the source in the table’s general note using your style’s wording, for example ‘Adapted from’ or ‘Reprinted from’ followed by the full reference details and a copyright statement, and include the source in your reference list. Reproducing or substantially adapting a copyrighted table usually also requires written permission from the publisher; re-tabulating reported values yourself normally needs attribution only.
How many tables are too many in a research paper?
As a rule of thumb, more than 5 or 6 tables in the main text of a standard-length article is too many, and most journals cap combined tables and figures at around 5 to 8. If you exceed the limit, merge related tables, convert trend-focused tables to figures, and move detail to the supplementary files.
Should tables in a research paper have vertical lines?
No. APA, AMA, Chicago, and almost every journal house style prohibit or strongly discourage vertical rules. A standard academic table uses exactly three horizontal lines (above the headings, below the headings, and below the body) plus optional short rules under spanner headings, and separates columns with spacing and alignment instead of lines.
What should you put in a table note?
Three things go in a table note, in this order: a general note (sample information, definitions of every abbreviation, formatting conventions such as ‘standard deviations in parentheses,’ and source credit for reproduced tables), specific notes tied to individual cells or columns with superscript letters, and a probability note defining significance symbols such as *p < .05. Together, the notes should let the table be completely understandable without the main text.


Comment