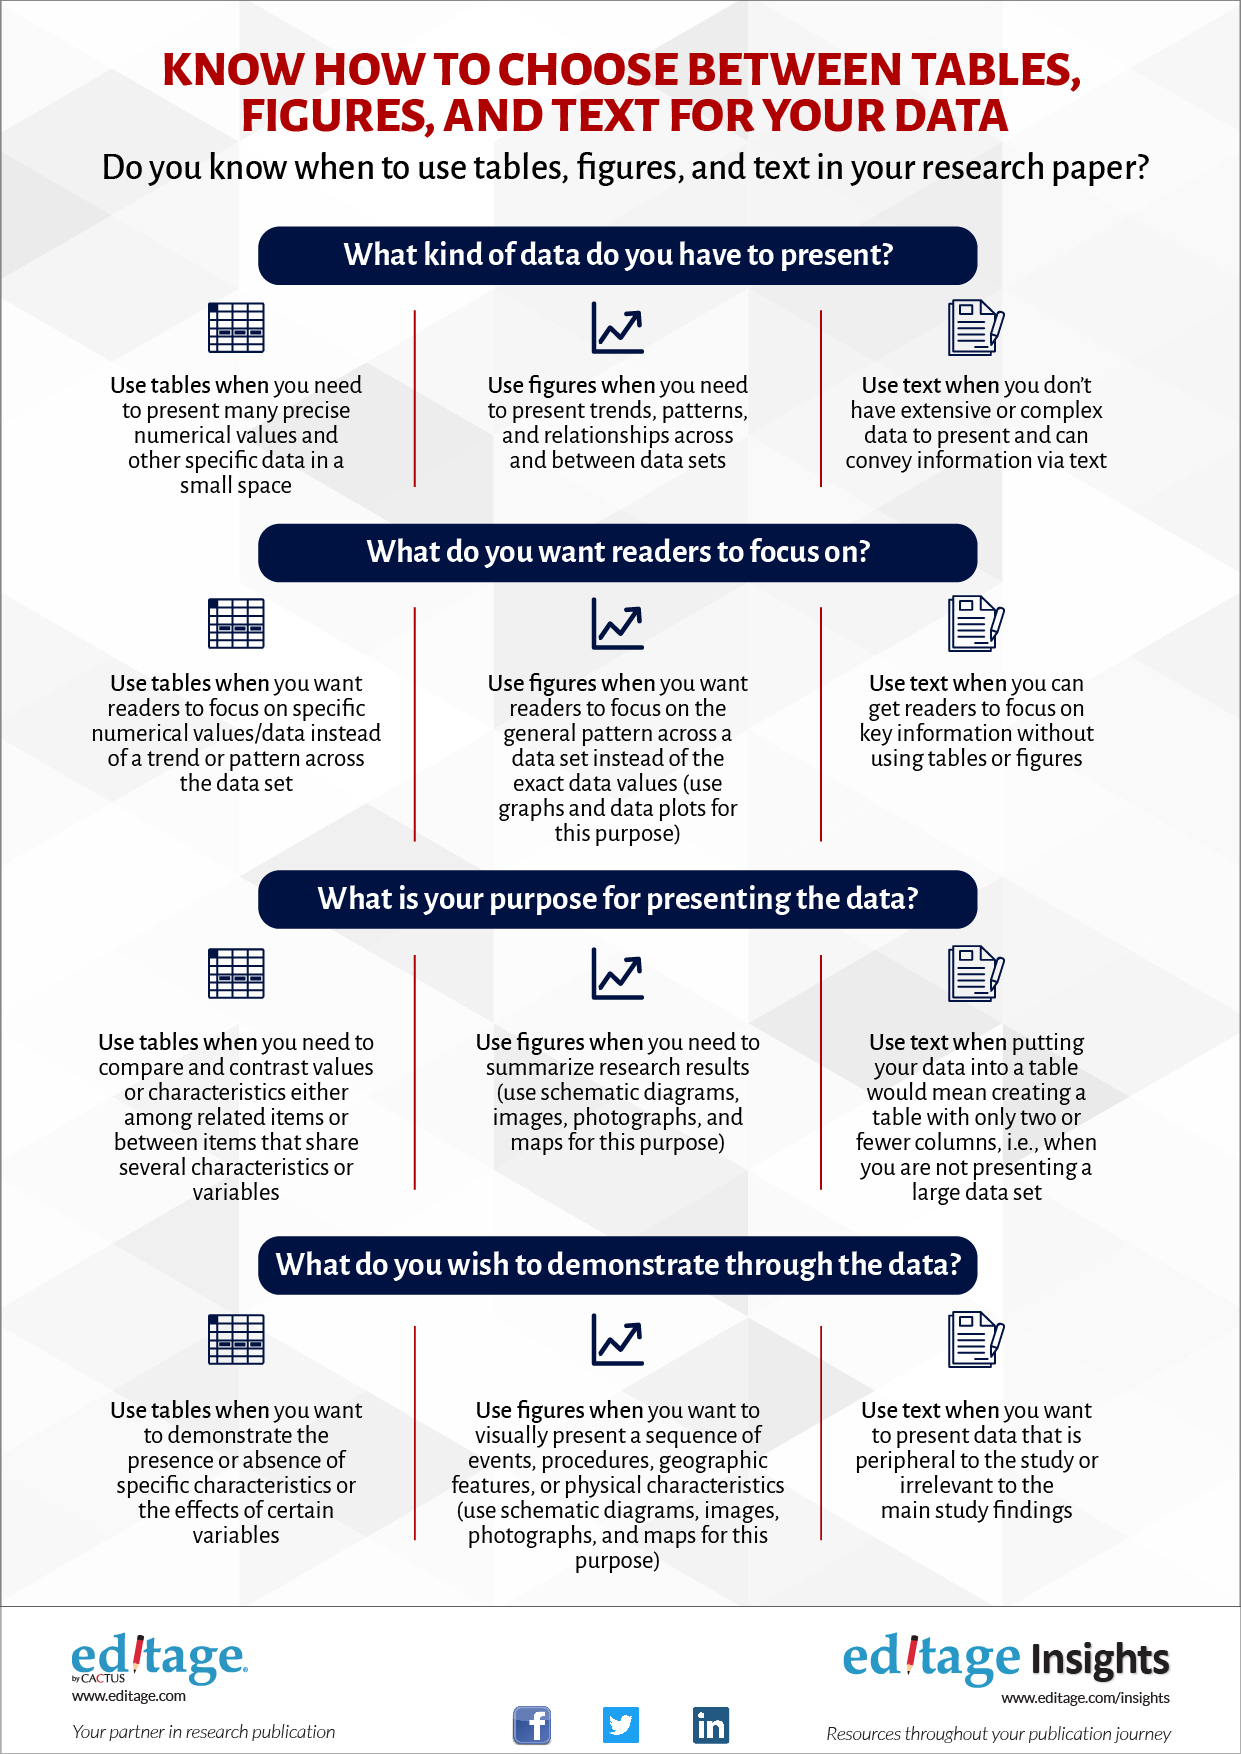
Infographic: Choosing between tables, figures, and text for your research data

One of the most challenging aspects of preparing your manuscript is deciding which format your research findings should be presented in. How should you decide whether your research data is best presented through tables, figures, or text? This infographic contains quick tips and questions you should ask yourself about the nature of the data you wish to present, while preparing your manuscript. It will help you make a more informed decision.
Feel free to download a PDF version of the infographic and use it as a handy reference.
Related reading:
- Tips on effective use of tables and figures in research papers
- 9 Tips on presenting your tables effectively
- 6 Easy guidelines for preparing tables and figures for a research manuscript
- 6 Tips for preparing impactful figures for a research manuscript
- Know when to use tables and figures in your research paper
Choosing between tables figures and text for your research data.pdf


