How to Create Graphical Abstracts Using AI Tools

As a researcher, it’s common to think that creating graphical abstracts is an added task to your already busy schedules! Besides, if designing is not your area of expertise, how do you verify the effectiveness of the finished visual abstract? Thankfully, there are several tools, some powered by artificial intelligence (AI), and services that can help navigate the graphical abstract creation process smoothly.
1. Using Design & Illustration Tools
2. Using AI Prompts for Image Generation
How to Improve AI-generated Graphical Abstracts
Use Professional Graphical Abstract Creation Services
Self-creation Methods
Planning to create a graphical abstract by yourself? Awesome! First, start identifying the right design tools that can help you in this process. They may or may not be AI design tools; in fact, the choice of tool depends on your requirements.
1. Using Design & Illustration Tools
Popular designing tools like Canva and Adobe Illustrator are quite user-friendly and easy-to-navigate platforms, and they produce visually appealing designs. But these tools are better suited for non-academic purposes, like marketing content promotions and social media poster creations.
Tools like Mind the Graph and BioRender, on the other hand, are specifically developed to facilitate the creation of scientific illustrations. They provide templates along with specialized icons and graphics that are relevant to scientific disciplines to help create effective visual abstracts. With options like
- thematic templates,
- neutral templates,
- drag-and-drop functionalities, and
- customized icons,
you can create graphical abstracts of different dimensions and orientations (landscape or portrait) while ensuring that they satisfy journal requirements.
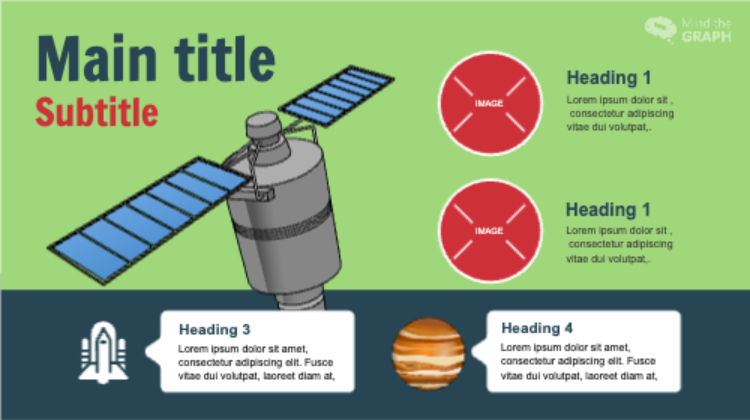
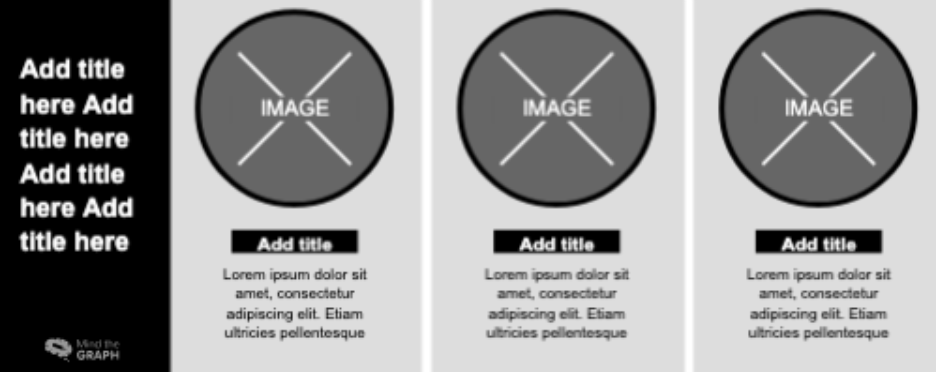
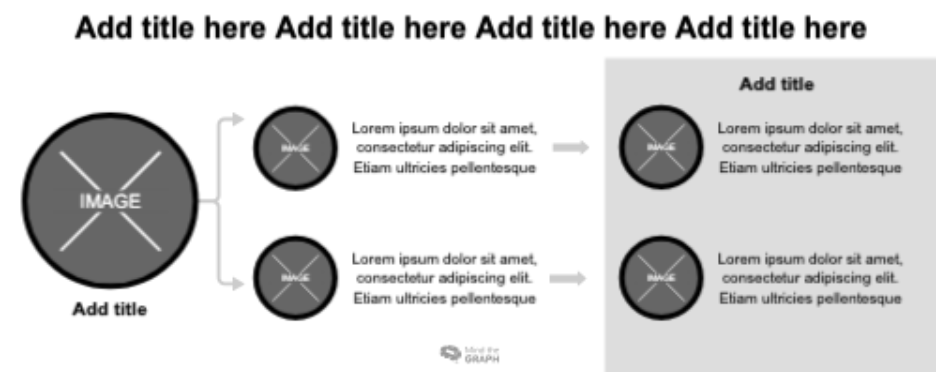
Below are some example templates available on Mind the Graph, which can be customized per your needs.
Example template 1: This format of presenting the main heading followed by sub-headings are best suited for straightforward studies that need to convey a clear message. Such single panel designs may be used to describe a sequence of events or depict a series of scientific conclusions.
Example template 2: This neutral template lets you divide your research into three panels, which could perhaps present the research background, methodology/analysis, and key findings in that order.
Example template 3: For more process-oriented studies, templates like the one below can help illustrate the steps through visual cues. Adding relevant yet minimal textual descriptions adjacent to the graphics can ensure a holistic design that conveys the key message of the research.
2. Using AI Prompts for Image Generation
Generative AI tools have considerably simplified image creation. But are they useful for creating graphical abstracts? Well, they can definitely fast-track your graphical abstract creation process. However, you must be aware of the right prompts to use to get the expected outcome.
Below are two graphical abstracts that were created by using the same prompt on different platforms (free version). Similar to the example below, you may input your textual abstract along with a specific prompt to help create a graphical abstract.
The prompt: A simple, straightforward prompt was input to two generative AI platforms, namely ChatGPT and Gemini, along with the abstract of a review paper [1].
“Create a graphical abstract for the following academic research paper abstract. Use simple easy-to-understand visuals: The purpose of this narrative review is to critically appraise recent advances in sports injury rehabilitation—primarily focusing on biopsychosocial (BPS) approaches alongside emerging technological innovations—and identify current gaps and future directions. A literature search was conducted in PubMed, Scopus, and Web of Science for the years 2018–2024. Eligible records were English-language, human studies comprising systematic reviews, clinical trials, and translational investigations on wearable sensors, artificial intelligence (AI), virtual reality (VR), regenerative therapies (platelet-rich plasma [PRP], bone marrow aspirate concentrate [BMAC], stem cells, and prolotherapy), and BPS rehabilitation models; single-patient case reports, editorials, and non-scholarly sources were excluded. The synthesis yielded four themes: (1) BPS implementation remains underutilized owing to a lack of validated tools, variable provider readiness, and system-level barriers; (2) wearables and AI can enhance real-time monitoring and risk stratification but are limited by data heterogeneity, non-standardized pipelines, and sparse external validation; (3) VR/gamification improves engagement and task-specific practice, but evidence is dominated by pilot or laboratory studies with scarce longitudinal follow-up data; and (4) regenerative interventions show mechanistic promise, but conclusions are constrained by methodological variability and regulatory hurdles. Conclusions: BPS perspectives and emerging technologies have genuine potential to improve outcomes, but translation to practice hinges on (1) pragmatic or hybrid effectiveness–implementation trials, (2) standardization of data and intervention protocols (including core outcome sets and effect-size reporting), and (3) integration of psychological and social assessment into routine pathways supported by provider training and interoperable digital capture.”
Graphical Abstract Created by ChatGPT
ChatGPT output the following image in a single prompt, visually summarizing the information covered in the abstract. As you can see, it first presents a title for the graphical abstract highlighting the main topic of the review. Furthermore, the existing challenges are provided with suitable pictorial icons and text before depicting the future directions for research.
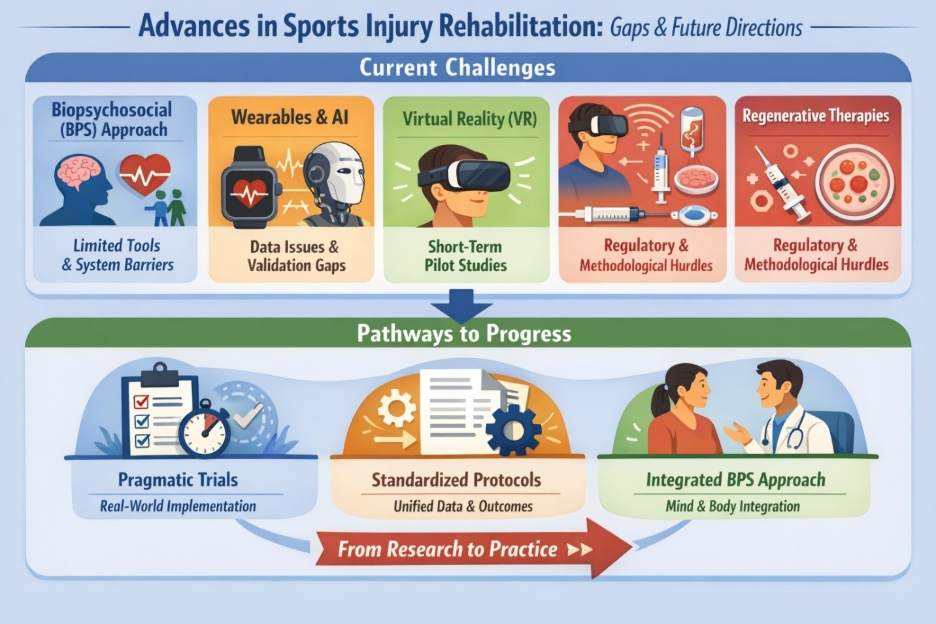
While the important parts are easily covered, there are a few repetitive details like “Regulatory & Methodological Hurdles” in the top half of the graphical abstract. Moreover, the icons for virtual reality and regenerative therapies appear to be merged to represent one of the current challenges of sports injury rehabilitation. This does not seem appropriate visually and could distort the research’s message.
Graphical Abstract Created by Gemini
When the same prompt was input to Gemini, it first generated a flowchart describing how the abstract can be visually presented in panels and explained what icons and content can be potentially used. A second prompt had to be used as follows to get the below image: “Give me a ready-to-use image by creating the panels with appropriate textual content.”
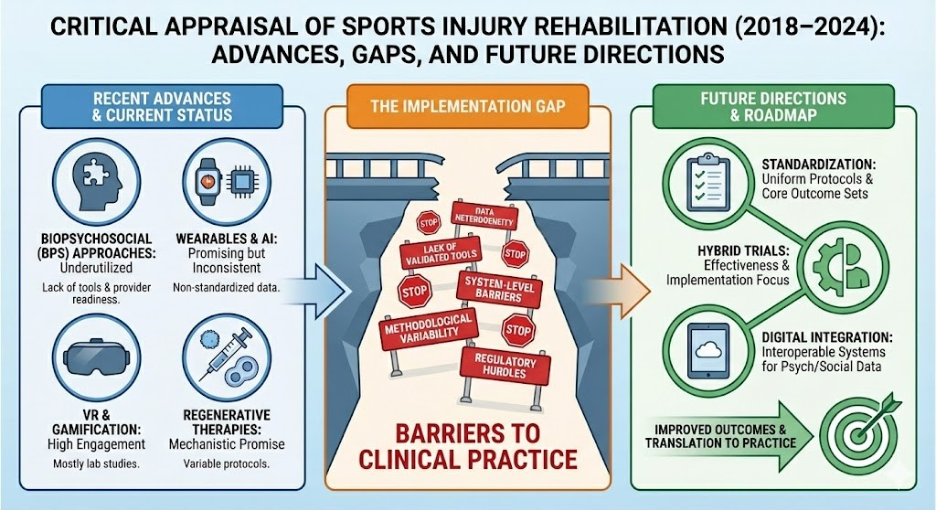
As you can see, a clear three-panel graphical abstract was created indicating the current status, gaps, and future directions of the research for sports injury rehabilitation. The “recent advances and current status” panel clearly shows four categories and highlights the knowledge gaps. The second panel highlights the challenges in implementation of existing methods, and the third panel visually summarizes a roadmap for future applications.
However, the “barriers to clinical practice” mentioned in the second panel are not entirely clear, and there appears to be some garbled text in one of the signboards. Also, the presentation of a broken bridge does not seem relevant to the context of the study. Furthermore, the title could be modified with more appropriate wording like “Critical appraisal of…(2018-2024): Present state, Gaps, and Strategic directions”
How to Improve AI-generated Graphical Abstracts
In both the above examples, the outcome is not perfect. This means that AI outputs must be treated as a starting point for graphical abstract creation rather than a finalized product. For instance, the above graphical abstracts can be modified on Canva to correct the mistakes and enhance the overall presentation. You may even choose to change the background colors, erase parts of images, change fonts, or replace icons as per your requirement.
In short, if you educate yourself on using the correct prompts and learn how to use certain functionalities on designing tools, you can create an effective graphical abstract that is journal ready.
Use Professional Graphical Abstract Creation Services
If creating visual abstracts on your own seems too time-consuming or burdensome, you can always opt for professional graphical abstract creation services. At Editage, we check the submission guidelines of target journals and create scientifically accurate designs that are visually appealing while highlighting the important parts of your research. The final output will be shared with you in the required format (e.g., jpg, pdf, png, tiff) and you can collaborate with our design experts until you are satisfied with the outcome.
Here is a video demonstration of how Editage creates graphical abstracts for their clients. You will see how Adobe Illustrator can be used to prepare a visual abstract based on raw data taken from a textual abstract.
Reference
1. Sports injury rehabilitation: A narrative review of emerging technologies and biopsychosocial approaches https://doi.org/10.3390/app15179788