New
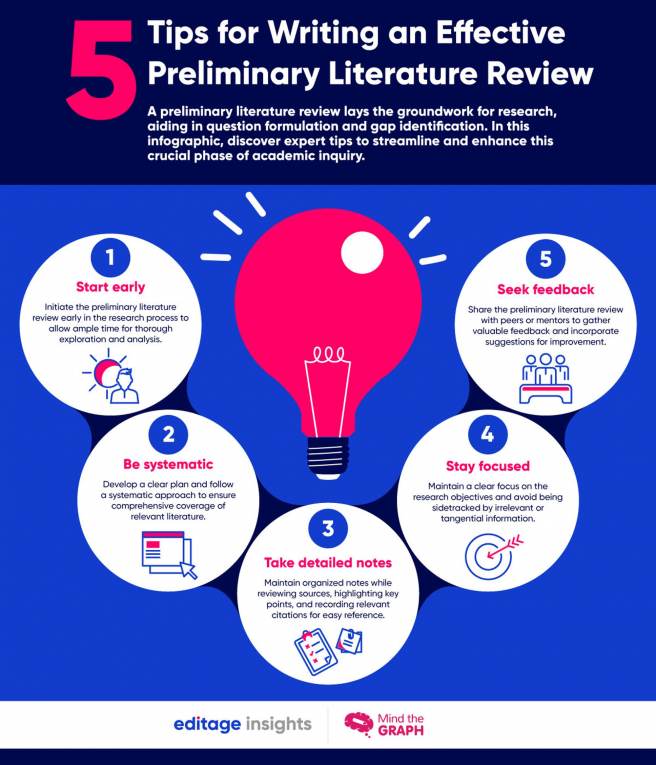
A preliminary literature review lays the groundwork for research, aiding in question formulation and gap identification. In this infographic, discover expert tips to streamline and enhance this…
This is an infographic, created by Mind the Graph, on the top 5 challenges associated with this form of publishing.
This infographic, created by Mind the Graph, lists 5 tips on how you may harness the power of AI while upholding the principles of integrity and transparency. 
This infographic, created using Mind the Graph, states 4 benefits of publishing open access.
This infographic, curated by Mind the Graph, lists 5 applications of AI in the academic world.
Infographics are incisive representations of data that are designed to facilitate comprehension and make it easier to understand and remember. This infographic explains the 6 benefits of using…
Infographics are visual communication formats containing graphs, charts, and illustrations. This article explores the role of infographics in healthcare and how they contribute to enhanced…
In this article, we’re going to talk about visual abstracts—what they are, what the different types are, how they help to enhance the communication of results, and what their overall impact is.
In this infographic, find out how you can design a compelling scientific poster.
Are you tired of struggling to communicate your research to your audience? This post explains in detail how to use two popular methods for visually conveying information - infographics and graphical…