How to make graphical abstracts for review papers

Key takeaway: Design a graphical abstract for a review paper by identifying 2-3 core themes, representing them visually in less than 50 words, arranging them left-right and top-down, ensuring the graphical abstract is legible even in condensed view, and complying with your target journal’s technical specifications.
Introduction
Review articles and original research articles serve different purposes in scholarly communication. Review articles synthesize findings from multiple studies on a topic, providing a comprehensive overview. Meanwhile, original articles present new findings, offering in-depth, specific data and insights on a focused topic. Both article types stand to benefit from graphical abstracts. In this post, we will discuss how to make graphical abstracts for review papers.
What is a graphical abstract?
A graphical abstract is a clear, brief, and visual snapshot of the main findings of a manuscript, communicating the essence of the article and its key message. To effectively reach a diverse audience, journals and academic publishers are incorporating web-friendly elements like graphical abstracts into their submissions. Graphical abstracts are also used in a journal’s table of contents and feeds such as RSS feeds.
Why make a graphical abstract for a review paper?
A graphical abstract helps your review article stand out and attract more citations. Review articles with graphical abstracts become more visible and shareable, resulting in a wider reach and readership.
Review articles are of great value to researchers and students because they summarize relevant studies, providing insights into trends, methodologies, and gaps in the literature. Therefore, they are commonly referred to when determining future research directions. However, review articles can be long and information-heavy. Moreover, there appears to be a trend of declining readability of scientific literature. Here’s where graphical abstracts can help.
Example:
This review article published in Materials Advances was featured as being a highly cited review article. Do you see the accompanying graphical abstract (also referred to as “Table of contents entry”)? Like many journals, Materials Advances (a journal publishing only reviews) asks for a catchy graphical abstract containing up to two sentences of text for its table of contents and web feeds (see a sample contents page with graphical abstracts).
You must be wondering, “How to make graphical abstracts for review papers?” Read on to know more!
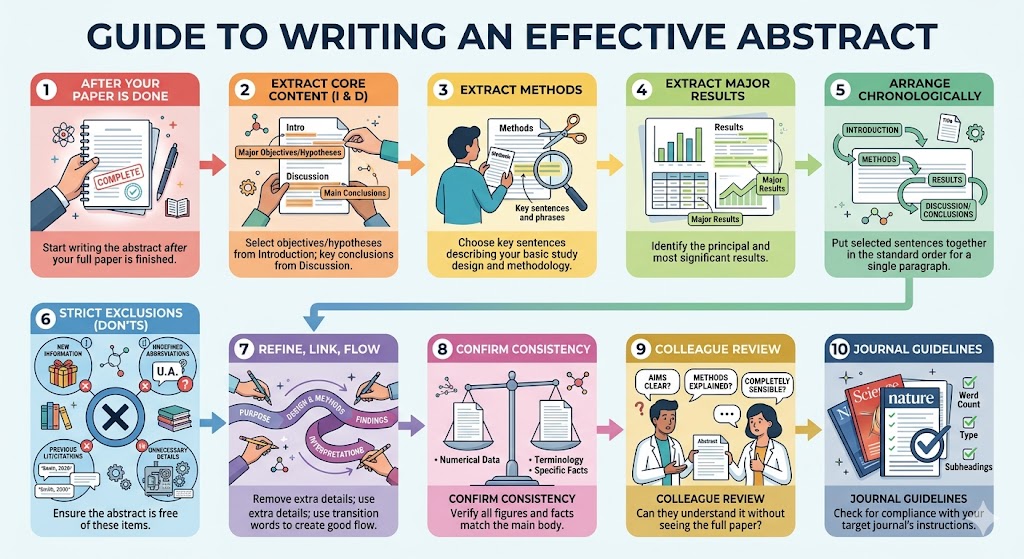
How to make a graphical abstract for a review paper
When designing the graphical abstract of a review paper,
- Use images, diagrams, or icons that represent key concepts or findings from your review.
- Avoid clutter and focus on clarity.
- Structure the content logically,
- Guide the reader through the main points in a coherent manner, typically via left-to-right or top-to-bottom layouts.
- Include a short description (around 50 words)
- Avoid excessive text or complex graphs that may confuse readers.
- Use fonts that are legible when the figure is compressed
- Use clear language and avoid technical jargon unless absolutely necessary.
- Follow a consistent color scheme and font style throughout your graphical abstract.
- Follow your target journal’s guidelines for size, resolution, file type, and other technical specifications
If this sounds like a lot of work, you can get expert assistance through Editage’s Graphical Abstract service.
How to use figures in the graphical abstract of a review paper?
You might need to reuse images (even your own) from published papers. In that case, be mindful of the following:
- If the figures are copyrighted, contact the copyright holder (usually the publisher) to request permission for reuse.
- If the figures fall under any of the Creative Commons licenses, check if your use falls under reuse without permission (e.g., CC-BY licenses are most permissive, allowing reuse with attribution) or limited reuse.
- Always give appropriate credit to the original source of the figure.
- Ensure that your target journal has specific guidelines regarding figure reuse and adhere to them during submission.
To boil it down
Designing a compelling graphical abstract for a review paper involves understanding its purpose, incorporating key components effectively, and complying with best practices and guidelines. A well-designed graphical abstract in the table of contents page might capture the attention of potential readers. Therefore, it is important not only for communicating your findings but also encouraging readers to engage with your work.
Frequently Asked Questions
1. What’s the difference between a graphical abstract and
an infographic?
A graphical abstract is a visual summary of your research paper’s key findings and is meant for an academic audience, whereas an infographic simplifies complex research for social media, public outreach, etc.
2. What free tools are available for designing graphical abstracts?
To design a graphical abstract, you could use
- Mind the Graph, which has a great library of custom templates for graphical abstracts along with high-quality scientific illustrations
- BioRender, which has the best and most comprehensive scientific icon library (but note that the files you export under the free version are not in a format and resolution suitable for journal publication)
- Canva, which is beginner friendly and versatile, but not specifically created for scientific visualization
3. What’s the right file size and format for a graphical abstract?
The file size and format for a graphical abstract can vary a lot across publishers and journals. You’ll have to consult the guidelines of your target journal and then create your image accordingly. But in general, make sure you’re submitting a single file with high resolution (300 dpi or more) unless your target journal explicitly specifies not to. Most journals ask for JPEG, TIFF, or PDF files.