Normality tests, parametric tests, and non-parametric tests: Uses and assumptions

In this article, you’ll learn
- What is normality?
- What are parametric tests?
- What are the best parametric tests?
- When can parametric tests be used?
- What are non-parametric tests
- Why should researchers use non-parametric tests?
What is normality?
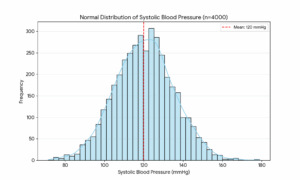
Normality in data means that the data looks like a bell-shaped curve when it is plotted in a histogram. For example, if you’ve a sample of 4000 patients at a hospital and are measuring blood pressure,
- Most patients cluster around the middle (around 120/80 mmHg)
- Fewer and fewer patients exist at the extremes (dangerously low or dangerously high)
- It’s symmetrical (the left side mirrors the right)
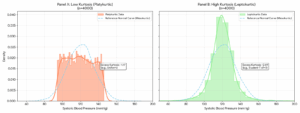
What is skewness?
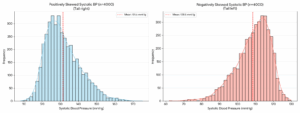
Skewness is about asymmetry. A normal bell curve is perfectly symmetrical, but skewness measures how much your data leans to one side. If most blood pressure readings are normal but a few patients have extremely high readings, the graph gets a long tail pulling to the right. That’s positive skew. If the graph leans left, you have a negative skew.
What is kurtosis?
Kurtosis is about how pointy or flat your bell curve is. High kurtosis means data is tightly packed around the average with extreme outliers. Low kurtosis means it’s more spread out and flat. Think of it as measuring whether your curve is a sharp mountain or a gentle hill.
Why should researchers check for normality?
Researchers need to check for normality before conducting many statistical tests because these tests require normality as a fundamental assumption. In other words, if you run such a test (called a parametric test) on data that isn’t normally distributed, you’ll end up with incorrect results.
Which are the best tests for normality?
There are a number of ways to check normality, explained in the table below:
| Test | Best Used When | Limitation |
| Shapiro-Wilk | Small to medium samples (n < 2,000): most powerful and widely recommended | Overly sensitive with very large samples |
| Kolmogorov-Smirnov | Large samples; comparing data to a known distribution | Weak with small samples; less sensitive than Shapiro-Wilk |
| Anderson-Darling | When you want to emphasize the tails of the distribution (important in medical data) | Less commonly supported in basic statistical software |
| Q-Q Plot | Quick visual check at any sample size | Subjective and relies on human interpretation |
| D’Agostino-Pearson | Medium to large samples; checks skewness and kurtosis together | Needs a sample size of more than 20 to be reliable |
While the easiest way to check for normality is to simply plot a histogram of your data and check its shape, this is pretty subjective.
What are parametric tests?
Parametric tests are statistical tests that rely on the assumption that your data are normally distributed. If your data are not normally distributed, these tests will produce unreliable results.
What are the best parametric tests?
The most popular parametric tests are as follows:
| Test | What it does |
| t-test | Compares means between 2 groups |
| ANOVA | Compares means across 3+ groups |
| Pearson correlation | Measures linear relationship between two variables |
| Linear regression | Predicts one variable from another |
When can parametric tests be used?
Parametric tests can be used if you have run a test for normality and confirmed that your data are normally distributed. Make sure that all the concerned variables are normally distributed. For example, if you’re examining the correlation between age and triglyceride level, but age is not normally distributed, you can’t run a Pearson’s correlation analysis.
What are non-parametric tests
Non-parametric tests are those that don’t require your data to be normally distributed. Most of these tests work by ranking the data rather than using raw values; that’s how they sidestep the normality assumption. They work just fine even if your data is heavily skewed or if you have ordinal (ranked) data.
Which are the best non-parametric tests?
The most popular non-parametric tests are as follows:
| Non-Parametric Test | What It Does | When to Use It | Parametric Equivalent |
| Mann-Whitney U | Compares distributions between 2 independent groups | 2 groups, non-normal data, ordinal/continuous outcome | Independent t-test |
| Wilcoxon Signed-Rank | Compares two related/paired measurements | Before-after designs, matched pairs | Paired t-test |
| Kruskal-Wallis | Compares distributions across 3+ independent groups | 3+ groups, non-normal data | One-way ANOVA |
| Friedman Test | Compares 3+ repeated measurements on the same subjects | Repeated measures, non-normal data | Repeated-measures ANOVA |
| Spearman Correlation | Measures monotonic relationship between two variables | Ordinal data or non-linear relationships | Pearson Correlation |
| Chi-Square Test | Tests association between two categorical variables | Frequency/count data, no normality needed | — (no direct equivalent) |
Why should researchers use non-parametric tests?
Non-parametric tests are your safety net. They are less powerful than parametric tests when assumptions are met, but far more trustworthy when they aren’t.
Here are some situations in which you should use non-parametric tests:
- Your data isn’t normally distributed: if your data is heavily skewed or has extreme outliers, the bell-curve assumption breaks down, making parametric tests unreliable.
- Your sample size is small: with very few observations (e.g., n < 30), you can’t confidently verify normality, so non-parametric tests are a safer choice.
- Your data is ordinal: if you’re working with ranked or rating-scale data (e.g. “rate your satisfaction 1–5”), calculating a mean doesn’t really make sense, but ranks do.
- Your data is categorical: for count or frequency data (e.g. “how many students passed vs. failed”), non-parametric tests like Chi-Square are the natural fit.
- You have outliers you can’t remove: since non-parametric tests use ranks instead of raw values, a single extreme value won’t distort your results.
- You’re measuring subjective responses: surveys, Likert scales, and opinion data rarely meet parametric assumptions, making non-parametric tests more honest and appropriate.
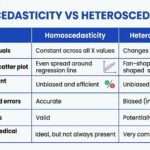
- Your variances are unequal across groups: parametric tests like ANOVA assume similar spread in each group; non-parametric tests don’t require this.
- You want to be cautious: when in doubt, non-parametric tests make fewer assumptions, so your conclusions are on safer statistical ground.
This article was initially published on September 4, 2023, and revised on May 16, 2026.