Cross-sectional Studies: Overview, Applications, Advantages, and Challenges
In this article, you’ll learn
- What is a Cross-sectional Study?
- How to conduct a cross-sectional study
- Types of Cross-Sectional Studies
- Cross-sectional Study Examples
- What are the differences between a cross-sectional study and a cohort study?
- What are the differences between a cross-sectional study and a case-control study?
- What are the differences between a cross-section study and longitudinal study?
- When to Conduct a Cross-sectional Study?
- Benefits and Limitations of Cross-sectional Studies
- How to critically appraise a cross-sectional study
As a researcher, you must be familiar with various study designs that support your investigations. In fact, you may have already applied several of them to your research. This article provides an overview of the cross-sectional study design, highlighting its applications with examples, major benefits, and the limitations involved.
What is a Cross-sectional Study?
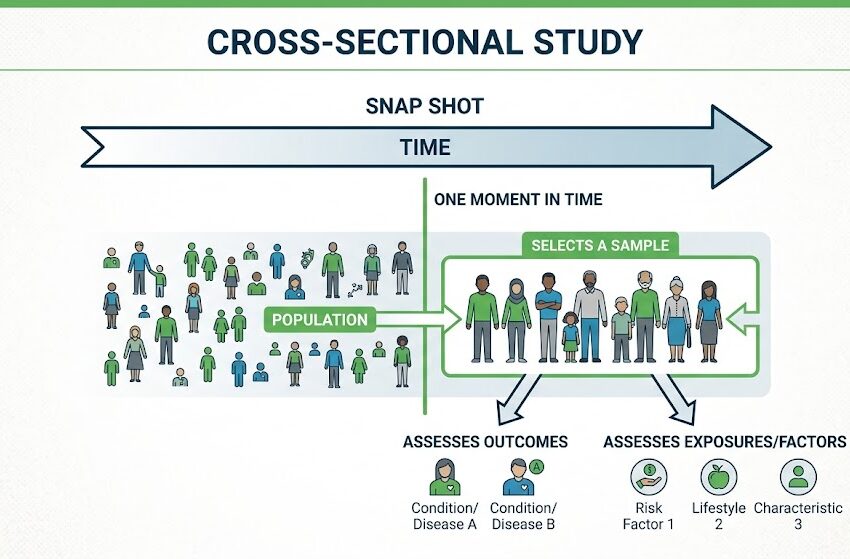
A cross-sectional research study is a type of observational research design in which data are collected from multiple individuals at a single point in time. This study design is commonly used to assess the prevalence of characteristics, behaviors, diseases, or other variables within a specific group without any intervention or influence.
How to conduct a cross-sectional study
Conducting a cross-sectional study involves the following steps:
Step 1: Define your research question and objectives
Begin by identifying exactly what you want to measure and in which population. A well-formed research question should specify the variable of interest (e.g., a behavior, condition, or attitude), the population you are studying, and the association or prevalence you hope to quantify.
Example of research question for a cross-sectional study
“What is the prevalence of burnout among ICU nurses in urban hospitals, and is it associated with shift length?”
A clearly defined objective at this stage will guide every subsequent decision, from who you recruit to how you analyze your data.
Step 2: Define the study population and eligibility criteria
Next, determine who will be included in your study. This involves setting inclusion criteria (characteristics participants must have, such as age range or professional role) and exclusion criteria (characteristics that would disqualify a participant, such as a pre-existing condition that could confound your results).
Being precise here reduces the risk of selection bias, which is one of the most common threats to validity in cross-sectional research.
Step 3: Choose a sampling strategy
Since cross-sectional studies typically work with large populations, you will rarely be able to survey everyone. Instead, select a sampling method that gives your sample the best chance of representing the broader population:
- Simple random sampling: every member of the population has an equal chance of being selected; ideal when a complete population list is available
- Stratified sampling: the population is divided into subgroups (e.g., by age or gender) and participants are sampled from each; useful when you want to compare subgroups
- Cluster sampling: naturally occurring groups (e.g., schools, hospitals) are randomly selected first, then individuals are sampled within them; practical when a full population list does not exist
- Convenience sampling: participants are recruited based on availability; quickest and cheapest, but most susceptible to bias and least generalizable
The larger and more representative your sample, the more confidently you can apply your findings to the wider population.
Step 4: Select your data collection method
Cross-sectional studies rely on measuring both the exposure (the variable you think may be linked to an outcome) and the outcome itself at the same point in time. Common data collection methods include:
- Surveys and questionnaires: the most widely used method; can be administered online, by post, or in person
- Structured interviews: useful when questions are complex or participants may need clarification
- Physical measurements or clinical assessments: used in health research (e.g., measuring BMI, blood pressure, or biomarkers)
- Existing records or databases: administrative data, medical records, or institutional data can provide a ready-made data source without requiring direct participant contact
Whichever method you choose, ensure your measurement tools are validated, that is, previously tested and shown to reliably measure what they claim to measure. Using a validated scale (such as the Maslach Burnout Inventory for burnout, or the Rosenberg Self-Esteem Scale for self-esteem) strengthens the credibility of your findings considerably.
Step 5: Collect and manage your data
With your instruments in place, proceed to data collection. At this stage, consistency is critical. All participants should be surveyed under the same conditions and within as narrow a time window as possible. A prolonged data collection period risks introducing temporal bias, where changes in external conditions (a policy change, a news event, a seasonal shift) affect responses differently across participants.
Once collected, your data should be checked for completeness, coded systematically, and stored securely in line with ethical and data protection requirements.
Step 6: Analyze your data
Cross-sectional data is typically analyzed using descriptive and inferential statistics:
- Descriptive statistics (frequencies, means, percentages) summarize the prevalence of variables across your sample
- Chi-square tests assess whether two categorical variables are associated (e.g., shift length and error rate)
- Logistic or linear regression allows you to examine associations between variables while controlling for confounders such as age, gender, or experience level
- Prevalence ratios or odds ratios quantify the strength of association between an exposure and an outcome
It is important to account for potential confounding variables in your analysis. These are factors that are related to both the exposure and the outcome, and which could distort your results if left unaddressed.
Step 7: Interpret and report your findings
When reporting your results, be precise about what your study can and cannot conclude. Cross-sectional studies identify associations: they do not establish causation. Clearly acknowledge this limitation in your discussion section, and avoid language that implies a cause-and-effect relationship where one has not been demonstrated.
What is the STROBE checklist?
The STROBE checklist (Strengthening the Reporting of Observational Studies in Epidemiology) is the internationally recognized standard for reporting observational research, including cross-sectional studies.
The STROBE checklist covers 22 items across the title, abstract, introduction, methods, results, and discussion, and ensures your study is reported with sufficient transparency for readers and peer reviewers to assess its validity.
Sample STROBE checklist
The STROBE checklist can be accessed at https://www.strobe-statement.org/checklists/ . You can also download a simple MS Word sample STROBE checklist here (note that the study reported is completely fictitious): STROBE_Checklist_Sample_for_Fictitious_Study
Types of Cross-Sectional Studies
Cross-sectional studies come in two main types, with a few subtypes worth knowing:
Descriptive cross-sectional studies
- Simply map out what exists in a population at a single point in time with no attempt to explain why
- Used to measure prevalence (how common something is), e.g. “What percentage of university students report high stress levels?”
- The starting point for most research as they help identify problems worth investigating further
Analytical cross-sectional studies
- Go a step further by looking for associations between variables, e.g. “Are students who sleep less than 6 hours more likely to report high stress?”
- Still can’t prove causation (because everything is measured at the same moment), but can suggest relationships
- Often use statistical tools like odds ratios or regression analysis to quantify associations
Other types of cross-sectional studies
Within these two types, you might also come across:
- Population-based studies: draw a sample from the general public (e.g. a national health survey); results can be generalised broadly
- Clinic- or institution-based studies: recruit participants from a specific setting like a hospital or university; faster and cheaper, but less generalisable
- Repeated cross-sectional studies: the same survey design is run on different samples at multiple time points (e.g. annually); useful for tracking trends over time without following the same individuals (note: this is different from a longitudinal study, where the same people are followed)
The key thing to remember: all cross-sectional studies share the same core feature, i.e., data is collected at one snapshot in time, but they differ in whether their goal is to describe or to find associations.
Cross-sectional Study Examples
Let’s understand more about cross-sectional studies with examples.
1. Cross-sectional study in healthcare
Suppose you want to assess the prevalence of obesity among adults in a city and explore its association with lifestyle factors, such as diet and physical activity. Here’s how you would approach it:
- Begin by surveying a randomly selected group of adults through questionnaires or medical check-ups at a single point in time.
- Then, collect data on each participant’s weight, height, dietary habits, exercise frequency, and demographic details.
- Finally, analyze associations between obesity and lifestyle factors, such as whether people who exercise less tend to have a higher body mass index (BMI).
Outcome: The study can identify patterns and correlations, such as “lower physical activity is linked to higher obesity rates.” However, it cannot confirm whether inactivity causes obesity or if obesity leads to reduced physical activity.
2. Cross-sectional study in sports science
Imagine you want to investigate the relationship between training habits and injury prevalence among football players. Your approach can be summarized as follows:
- Survey a group of amateur and professional football players at a single point in time, collecting data on training frequency, intensity, and past injuries.
- Record variables such as age, position played, stretching routines, and history of injuries.
- Analyze associations between training habits and injury occurrence rates—for example, whether players who train more than five times a week are more likely to experience muscle injuries.
Outcome: This study can help identify trends, such as a higher injury rate among players with intense training schedules. However, it cannot determine causation—whether frequent training causes more injuries or if already-injured players report more training sessions due to recovery programs.
In both these examples, you will notice that the study only establishes correlations and does not determine causation. To analyze behavior over time or identify long-term trends, a longitudinal study is required.
Cross-sectional study in education
Imagine you want to investigate the relationship between smartphone use during class and academic performance among high school students. Your approach can be summarized as follows:
- Survey a group of students across different year groups at a single point in time, collecting data on daily in-class phone use, self-reported distraction levels, and most recent exam scores.
- Record variables such as grade level, subject, teacher-set phone policies, and socioeconomic background.
- Analyze associations between phone use frequency and academic performance: for example, whether students who report using their phones more than three times per class period have lower average grades.
Outcome: This study can reveal patterns, such as a correlation between higher in-class phone use and lower exam scores. However, it cannot confirm causation: whether phone use reduces academic performance, or whether already-disengaged students are simply more likely to reach for their phones.
Cross-sectional study in management research
Imagine you want to explore the relationship between remote work arrangements and employee burnout across different industries. Your approach can be summarized as follows:
- Survey employees from a range of organizations at a single point in time, collecting data on their work arrangement (fully remote, hybrid, or in-office), weekly working hours, and burnout levels using a standardized measure such as the Maslach Burnout Inventory.
- Record variables such as industry, job role, years of experience, access to a dedicated workspace at home, and managerial support levels.
- Analyze associations between work arrangement and burnout scores: for example, whether fully remote employees in managerial roles report higher emotional exhaustion than their in-office counterparts.
Outcome: This study can surface trends, such as higher burnout rates among remote workers who lack a dedicated home office. However, it cannot determine causation: whether remote work itself drives burnout, or whether employees already experiencing burnout are more likely to have sought remote arrangements in the first place.
Cross-sectional study in consumer behavior
Imagine you want to investigate the relationship between environmental attitudes and willingness to pay a premium for sustainable products among urban shoppers. Your approach can be summarized as follows:
- Survey a group of shoppers across urban retail locations at a single point in time, collecting data on their environmental attitudes (using a scale such as the New Ecological Paradigm), purchasing habits, and the maximum price premium they would accept for a sustainable alternative.
- Record variables such as age, income level, education, frequency of sustainable purchases, and exposure to eco-labelling.
- Analyze associations between environmental attitudes and spending behavior: for example, whether shoppers who score highly on environmental concern are willing to pay 20% or more above the standard product price.
Outcome: This study can highlight patterns, such as stronger pro-environmental attitudes correlating with higher willingness to pay for sustainable goods. However, it cannot confirm causation: whether positive environmental attitudes drive sustainable purchasing decisions, or whether frequent buyers of sustainable products have simply rationalized and reinforced those attitudes over time.
Cross-sectional study in nursing
Imagine you want to examine the relationship between shift length and medication error rates among nurses working in acute care settings. Your approach can be summarized as follows:
- Survey a group of nurses across different hospital wards at a single point in time, collecting data on their typical shift length (8-hour vs. 12-hour shifts), self-reported fatigue levels, and the number of medication errors or near-misses they recall from the past month.
- Record variables such as years of clinical experience, ward type (e.g., ICU, general medicine, emergency), patient-to-nurse ratio, and access to clinical decision-support tools.
- Analyze associations between shift length and error frequency: for example, whether nurses working 12-hour shifts report a significantly higher rate of medication near-misses than those on 8-hour shifts, particularly in the final hours of their shift.
Outcome: This study can identify patterns, such as a correlation between longer shifts and higher self-reported error rates, especially in high-acuity wards with stretched staffing ratios. However, it cannot establish causation: whether longer shifts directly cause more medication errors due to fatigue, or whether understaffed wards are simultaneously more likely to require extended shifts and to experience higher baseline error rates regardless of shift length.
What are the differences between a cross-sectional study and a cohort study?
| Cross-sectional study | Cohort study | |
| Definition | Collects data from a population at a single point in time | Follows a group of participants over an extended period of time |
| Time frame | One snapshot, no follow-up required | Longitudinal: data collected at multiple time points |
| Can establish causality? | No, only identifies associations | Yes, can suggest cause-and-effect relationships |
| Data collection | Once, from all participants simultaneously | Repeatedly, from the same participants over time |
| Sample size | Typically large | Typically smaller, more defined group |
| Cost and time | Low cost, quick to complete | High cost, time-intensive |
| Risk of dropout | None because participants surveyed only once | High: participants may drop out over time |
| Best used for | Measuring prevalence of a condition or behavior | Tracking how a condition or behavior develops over time |
| Example | Surveying nurses on fatigue and error rates today | Following nurses over five years to track how burnout develops |
What are the differences between a cross-sectional study and a case-control study?
| Cross-sectional study | Case-control study | |
| Definition | Collects data from a population at a single point in time | Compares people who have a condition (“cases”) against those who do not (“controls”) |
| Starting point | Starts with a general population sample | Starts with the outcome: identifies cases first, then finds matched controls |
| Time frame | One snapshot: no follow-up or look-back | Retrospective: it looks backward to identify past exposures |
| Can establish causality? | No, only identifies associations | Partial, can suggest likely causes but remains observational |
| Direction of inquiry | Exposure and outcome measured simultaneously | Begins with outcome, then investigates prior exposure |
| Data collection | Collected once, at the same moment for all participants | Collected by comparing past records or recall between two distinct groups |
| Sample size | Typically large | Typically smaller because cases can be rare or hard to find |
| Cost and time | Low cost, quick to complete | Moderate cost; faster than cohort studies but requires careful matching |
| Risk of bias | Susceptible to prevalence bias and confounding | Susceptible to recall bias: cases may remember past exposures differently than controls |
| Best used for | Measuring how common a condition or behavior is | Investigating the causes of rare diseases or outcomes |
| Example | Surveying university students on sleep habits and stress levels today | Comparing lung cancer patients with healthy individuals to identify differences in past smoking history |
What are the differences between a cross-section study and longitudinal study?
While a cross-sectional study examines multiple subjects at a single point in time, a longitudinal study follows the same group of subjects over an extended period of time. In a longitudinal study, data are often collected from smaller groups of individuals who share a common trait.
| Cross-sectional study | Longitudinal study | |
| 1. | Examines a diverse group of subjects at a single point in time. | The same group of subjects is studied over a certain time period. |
| 2. | A large pool is used for data collection. | Generally, data collection occurs from smaller groups of individuals who share a common trait. |
When to Conduct a Cross-sectional Study?
With multiple study designs, you may wonder when a cross-sectional study is the best choice. Here are some pointers:
- Ideal for determining prevalence: Cross-sectional studies can effectively assess the prevalence of behaviors and study associations between multiple exposures and outcomes. For instance, a cross-sectional study would be ideal for analyzing the prevalence of cyberbullying among high school students and its association with social media usage.
- Cost-effective and time-efficient: Since data is collected only once, cross-sectional studies save time and money while setting up a foundation for further research.
- Applicable to both descriptive and analytical studies: For example, if you want to study sports injuries among college athletes, a descriptive study might examine the prevalence of injuries in different sports (e.g., the number of football players experiencing ankle sprains). By contrast, an analytical study would investigate risk factors, such as training intensity, warm-up routines, and playing surfaces, to understand why some athletes are more prone to injuries than others.
When a cross-sectional study is the right choice
A cross-sectional study is the right choice when you need a prevalence estimate quickly, when your research question is exploratory or hypothesis-generating, when budget and time are constrained, when the condition or behavior is common enough to appear in a snapshot, and when no causal claim is needed. See the table below:
| Research scenario | Is a cross-sectional study appropriate? |
| You want to know how common a condition is in a population | Yes: prevalence estimation is the primary use case |
| You want to explore whether two variables are associated | Yes: suitable for generating hypotheses |
| You want to prove that one variable causes another | No: cannot establish causality; consider a cohort study |
| Your outcome of interest is rare (less than 1% prevalence) | No: unlikely to capture enough cases in a snapshot; consider a case-control study |
| You have limited time and budget | Yes: single data collection point makes it the most resource-efficient observational design |
| You need to track how something changes over time | No: a longitudinal or cohort design is required |
| You are in the early stages of research and want to justify a larger study | Yes: useful as a pilot or foundation study |
| Your exposure or behavior fluctuates rapidly (e.g., acute pain, daily mood) | Use with caution because a single snapshot may not capture typical behavior |
When is a cross-sectional study NOT the right choice?
We now look at situations where a different design is needed: when causality must be established, when the outcome is rare, when temporal sequence matters, and when studying a behavior that fluctuates rapidly over time (e.g., mood, acute symptoms).
| Research goal | Recommended design | Why not cross-sectional? |
| Check whether exposure A causes outcome B | Cohort study | Cross-sectional captures both at the same time, there is no temporal sequence |
| Investigate causes of a rare disease | Case-control study | Rare outcomes are unlikely to appear in a population snapshot |
| Track how individuals change over time | Longitudinal study | A snapshot cannot show within-person change |
| Test whether an intervention works | Randomised controlled trial | Cross-sectional is observational only and can’t test an intervention |
Signs your research question suits a cross-sectional design
Ask yourself the following questions before committing to a cross-sectional study. If most of your answers are yes, this design is likely the right fit for your research.
- Your question asks “how common” or “how prevalent.” If you are trying to quantify how widespread a condition, behavior, or attitude is within a population (e.g., “What proportion of L&D nurses report symptoms of burnout?”) a cross-sectional study is your most direct route to an answer.
- You are exploring associations, not proving causes. If your goal is to examine whether two variables are related, rather than to demonstrate that one causes the other, a cross-sectional design is appropriate. Save the causal language for a follow-up study.
- A single snapshot is sufficient. If the variable you are measuring is relatively stable over time (e.g., a chronic condition, a demographic characteristic, or an established attitude) capturing it at one point in time will give you a reliable picture.
- You are in the early stages of a research program. Cross-sectional studies are well-suited to pilot work. If you need preliminary data to justify a larger cohort study or a grant application, this design gives you useful estimates quickly and at low cost.
- Your resources are limited. If time, funding, or access to participants rules out repeated data collection, a cross-sectional study is the most practical observational design available to you.
- Your outcome is common enough to detect. If the condition or behavior you are studying occurs frequently enough to appear in a reasonably sized sample, a snapshot approach will capture it. If it is rare, a different design will serve you better.
Benefits and Limitations of Cross-sectional Studies
Like all study designs, cross-sectional studies have certain advantages and drawbacks.
Advantages
✅Quick and cost-effective: Cross-sectional studies are faster and less expensive than longitudinal studies because data are collected at a single point in time.
✅Useful for measuring prevalence: They help determine how common a condition, behavior, or characteristic is within a specific population. By collecting data from a large subject pool, cross-sectional studies allow for comparisons between groups.
✅No follow-up necessary: Since participants are surveyed only once at a specific time point, there is no risk of dropout, which is a common issue in longitudinal (long-term) studies.
Drawbacks
❌Cannot establish causality: Cross-sectional studies provide a snapshot of both the alleged cause and effect, identifying associations but not confirming cause-and-effect relationships.
❌Susceptible to confounding variables: External factors that influence the results are not often accounted for, which may result in misleading conclusions.
❌Limited to a single time point: These studies do not capture changes over time, rendering them unsuitable for studying trends or long-term effects.
How to critically appraise a cross-sectional study
Critical appraisal of a cross-sectional study is not a binary pass-or-fail judgment: it is a calibrated assessment of how much confidence you can place in the findings, given the design choices made and the limitations acknowledged.
Reading a cross-sectional study and appraising one are two different things. Critical appraisal means systematically evaluating whether a study was designed and conducted well enough for its findings to be trusted, and whether those findings are relevant to your own research or clinical context. For researchers, reviewers, and graduate students, this is an essential skill that sits at the heart of evidence-based practice.
What is the purpose of critical appraisal?
Critical appraisal is not about finding fault with a study. It is a structured process of asking whether the methods used were appropriate, whether the results are reliable, and whether the conclusions drawn are justified by the data.
Why should cross-sectional studies be appraised differently?
Cross-sectional studies are appraised differently from randomized controlled trials or cohort studies because their strengths and vulnerabilities are different. The questions you ask of a cross-sectional study should reflect what this design can and cannot do.
A well-appraised study helps you decide how much weight to give its findings when you are writing a literature review, conducting a systematic review, or making an evidence-based decision in a clinical or policy setting.
Core aspects of appraising a cross-sectional study
For cross-sectional studies specifically, appraisal focuses on three core aspects:
- Was the study designed in a way that minimizes bias?
- Were the measurements valid and reliable?
- Are the findings applicable beyond the study sample?
What is the CASP checklist for cross-sectional studies?
The most widely used tool for appraising cross-sectional studies is the CASP (Critical Appraisal Skills Programme) checklist. Developed in the UK and used internationally, the CASP checklist provides a structured set of questions organized around three broad areas: the validity of the study, the results, and their applicability. It is freely available at casp-uk.net and is suitable for use in systematic reviews, journal clubs, and graduate coursework.
The checklist covers eleven items grouped as follows:
- Section A: Is the study valid? This section examines whether the study was designed and conducted in a way that produces trustworthy results. Key questions include whether the study addressed a clearly defined research question, whether the sample was representative, whether the exposure and outcome were measured accurately, and whether confounding factors were identified and accounted for.
- Section B: What are the results? This section focuses on the findings themselves. It asks whether the results are clearly presented, what the size and precision of any reported associations are, and whether the results are plausible given what is already known about the topic.
- Section C: Will the results help locally? This section evaluates the applicability of the findings. It asks whether the study population is similar enough to your own context to make the results relevant, and whether the findings could be applied in practice.
Key appraisal questions to ask of any cross-sectional study
Whether you are using the CASP checklist or appraising a study independently, the following questions should guide your evaluation:
On study design and sampling
- Was the research question clearly stated, with a defined population, exposure, and outcome?
- Was the sample recruited in a way that minimizes selection bias? Convenience samples drawn from clinics or universities may not represent the broader population.
- Was the sample size justified? Did the authors conduct a power calculation or provide a rationale for the number of participants recruited?
On measurement
- Were the exposure and outcome measured using validated tools? Self-reported data collected through unvalidated questionnaires introduces measurement error and weakens the reliability of findings.
- Were all participants measured in the same way, under the same conditions? Inconsistent data collection procedures introduce variability that can distort results.
- Was there a risk of recall bias? When participants are asked to report past behaviors or exposures from memory, their responses may be inaccurate or shaped by their current health status.
On confounding
- Did the authors identify potential confounders (variables that could explain the association between the exposure and outcome) and account for them in the analysis?
- Was multivariable analysis used to adjust for confounders, or were associations reported only at the bivariate level?
On results and interpretation
- Are the associations reported with appropriate measures of precision, such as confidence intervals and p-values?
- Do the authors clearly distinguish between association and causation? A well-reported cross-sectional study will never claim that the exposure caused the outcome but only that the two are statistically related.
- Are the limitations of the study acknowledged honestly, including the inability to establish temporal sequence?
On applicability
- Is the study sample similar enough to your population of interest for the findings to be relevant?
- Are the measurement tools and outcome definitions used in the study consistent with those used in your own context?
Common weaknesses to look for when appraising a cross-sectional study
Even well-published cross-sectional studies can have methodological shortcomings. When appraising a study, watch for the following:
- Convenience sampling: recruiting participants based on availability rather than through a systematic process is one of the most common sources of selection bias in cross-sectional research. Findings from convenience samples have limited generalizability.
- Self-reported outcomes without validation: relying on participants to accurately report their own behaviors, symptoms, or exposures introduces social desirability bias and recall bias. Look for studies that use validated scales or triangulate self-report with objective measures.
- No adjustment for confounders: studies that report only unadjusted associations without controlling for obvious confounders (such as age, sex, or socioeconomic status) should be interpreted with considerable caution.
- Overstated conclusions: perhaps the most frequent problem in cross-sectional research is language that implies causation. Phrases such as “X leads to Y” or “X increases the risk of Y” are not supported by a cross-sectional design. Look for hedged, appropriately cautious language in the discussion and conclusion.
- Temporal ambiguity: because exposure and outcome are measured simultaneously, it is impossible to know which came first. Authors should acknowledge this explicitly; those who do not are overstating the strength of their evidence.
A practical appraisal workflow for cross-sectional studies
If you are appraising a cross-sectional study for a systematic review, a literature review, or a journal club, the following sequence will help you work through it efficiently:
- Read the abstract first to form an initial impression of the study’s purpose, design, and main findings.
- Go to the methods section and evaluate the sampling strategy, eligibility criteria, sample size justification, and measurement tools before reading the results.
- Apply the CASP checklist systematically, recording your responses to each item.
- Read the results with the methods in mind: check whether the statistical approach matches what was described, and whether confidence intervals are reported alongside point estimates.
- Evaluate the discussion critically: assess whether the authors’ interpretation is supported by their data, whether limitations are disclosed fully, and whether the conclusions are appropriately cautious.
- Make an overall quality judgment: most appraisal frameworks classify studies as high, moderate, or low quality based on the number and severity of methodological concerns identified. Document your reasoning clearly, especially if you are conducting a systematic review where quality assessment affects how evidence is weighted.
Key Takeaways
Depending on the study objective and research question, a cross-sectional study design can be an effective choice for investigating behavioral patterns. It is particularly useful for conducting an initial analysis before exploring long-term trends in greater depth.
Frequently Asked Questions
Can a cross-sectional study establish causality?
No, a cross-sectional study cannot verify whether one variable (e.g., fiber intake) causes another (e.g., poor glycemic control). It can only show that two or more variables are statistically related.
What is prevalence in a cross-sectional study?
In a cross-sectional study, the term “prevalence” refers to the total number or proportion of individuals who currently have a condition, including those who were diagnosed in the past.
What is the difference between a cross-sectional study and a survey?
A cross-sectional study is a research design that observes a population at a single point in time, whereas a survey is a method of collecting data (like a questionnaire). A cross-sectional study may or may not use a survey, and surveys can be used in other study designs (e.g., longitudinal studies) as well as in cross-sectional studies.
Is a cross-sectional study qualitative or quantitative?
Cross-sectional studies can be qualitative, quantitative, or mixed-methods (i.e., both). In fields like healthcare and nursing, however, the majority of cross-sectional studies are quantitative.
What types of bias affect cross-sectional studies?
Cross-sectional studies are vulnerable to several types of bias that can distort their findings:
- Selection bias: if the sample is not representative of the broader population (e.g., recruiting only clinic patients or university students), the results cannot be generalised. People who agree to participate may also differ systematically from those who decline.
- Recall bias: when participants are asked to remember past behaviors or exposures, their recollections may be inaccurate or unconsciously shaped by their current health status or beliefs.
- Social desirability bias: participants may underreport behaviors they consider embarrassing or socially unacceptable (e.g., alcohol consumption, medication non-adherence) and overreport behaviors they see as positive.
- Prevalence-incidence bias (Neyman bias): because the study captures only people who currently have a condition, it misses those who recovered quickly or died before the data was collected, skewing the picture of who is typically affected.
- Measurement bias: using unvalidated questionnaires or inconsistent data collection procedures introduces systematic errors in how exposures and outcomes are recorded.
- Confounding: a third variable linked to both the exposure and the outcome can create the appearance of an association that does not truly exist, or mask one that does.
How large should the sample size be in a cross-sectional study?
There is no fixed number for a sample size in a cross-sectional study but you must ensure that the sample is sufficiently large so that the study has adequate statistical power. You should use a sample size formula. The standard approach uses four inputs: the estimated prevalence of your outcome, your desired confidence level (typically 95%), your acceptable margin of error (commonly ±5%), and an adjustment for expected non-response. Learn more about statistical power in this article.
Also, keep in mind the following while calculating sample size:
- Prevalence of the outcome matters most. Rarer conditions require larger samples to detect reliably. A condition affecting 25% of a population needs far fewer participants than one affecting 0.5%.
- Account for non-response. Always inflate your target sample size by 10–20% to compensate for participants who drop out, decline, or return incomplete responses.
- Subgroup analyses need larger samples. If you plan to compare subgroups (e.g., by age or gender), each subgroup needs sufficient numbers to detect associations independently.
This article was originally published on May 21, 2025, and updated on May 22, 2026.