Effective data presentation increases research impact

Case: One of our clients had sent us his manuscript to edit. During the edit, our editor suggested that the significance of the findings could be clearer if the data was presented in the form of a graph instead of a table. However, the graphical representation that we recommended required some more data, which meant that the author would have to conduct a few more experiments. Since this did not seem to be a necessary revision but an improvement at that point in time, we proposed this as an optional change.
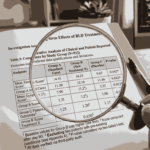
The author agreed that the change would definitely enhance the paper, but was not very keen on it since it would be time-consuming. However, when the author received peer review comments, several questions were raised about the table. The reviewers had asked for quite a few clarifications as the table lacked lucidity.
Action: We then recommended that the author use the graphical representation we had suggested, even if it meant conducting a couple of more experiments. The author followed our advice and provided us with the additional raw data. We helped the author represent this data in the graphical format suggested by our editor. Once the revised manuscript was submitted, it was sent for a second round of peer review. This time the reviewers were satisfied and gave positive comments about the additional data and the graphical format it was presented in.
Summary: Effective presentation of data is very important for the reader to understand the impact of a situation or an experiment. Sometimes, authors might not be able to identify the most impactful way to present data. They should do some careful thinking about the best way to represent data and ask for suggestions from experienced colleagues or professors when in doubt.
It would also do well if authors read up some information on how data can be presented effectively. The table/figure should be self-explanatory and should be able to give the reader a clear picture of the situation without requiring him/her to go back to the text for clarifications. Effective presentation of data is not only a significant enhancement to your paper, but also a necessity to present the concepts in your study clearly.