Independent vs. dependent variables: Key differences with examples
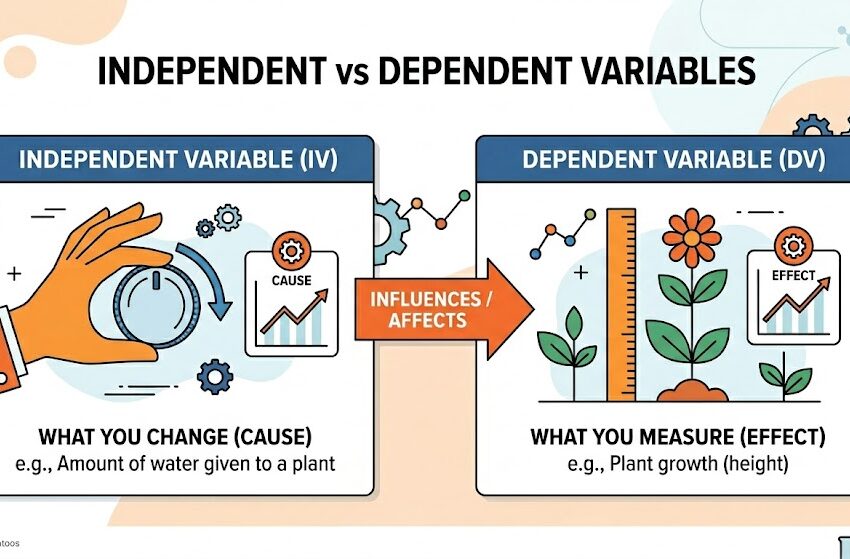
The independent variable is what the researcher changes/controls in a study and the dependent variable is what the researcher measures/observes in response to that change. Understanding independent and dependent variables is fundamental to research design, from forming a hypothesis and operationalizing measures to choosing the right statistical test and interpreting your results.
Jump to Contents
- Introduction
- What Is an Independent Variable?
- What Is a Dependent Variable?
- Difference Between Independent and Dependent Variables
- Examples for Independent vs. Dependent Variables
- What Is a Controlled Variable? (And How It Differs)
- Differences between independent, dependent, and controlled variables
- Examples of independent, dependent, and controlled variables across disciplines
- Independent and Dependent Variables in Research Design
- How Independent and Dependent Variables Are Operationalized
- Using Independent and Dependent Variables in Statistical Analysis
- Independent and dependent variables in qualitative research
- Conclusion
Introduction
In academic research, the terms independent variable (also called explanatory variable) and dependent variable are essential for designing experiments, analyzing data, and drawing conclusions. These variables help establish a cause-and-effect relationship, where one factor (independent) influences another (dependent).
In simple terms,
- The independent variable is what the researcher changes or controls.
- The dependent variable is what is measured or observed in response to that change.
Here’s an everyday example: Say you are testing whether drinking coffee affects productivity. The amount of coffee you drink is the independent variable, and your level of productivity is the dependent variable—it depends on how much coffee you consume.
In academia, identifying these variables helps researchers analyze relationships between factors, forming the foundation of scientific studies.
What Is an Independent Variable?
An independent variable is the factor that a researcher deliberately changes, controls, or manipulates in an experiment to observe its effect on another variable. It represents the presumed cause in a cause-and-effect relationship and is central to how a study is designed.
Example
In a simple experiment testing whether caffeine improves focus, the amount of caffeine given to participants is the independent variable. The researcher controls it, and everything else is measured in response to it.
In non-experimental research, the independent variable may not be actively manipulated but is still the factor used to predict or explain differences in the outcome. For example, in a survey study examining how income level relates to healthcare access, income level functions as the independent variable even though the researcher cannot assign it to participants.
What are the Types of Independent Variables?
Independent variables can be broadly categorized into two types based on how they are manipulated or observed in research:
1. Experimental independent variables
Experimental independent variables are those that researchers can directly manipulate to observe their effect on the dependent variable. These variables can be adjusted at different levels to study variations in the outcome.
Example: A study examines the effect of sleep duration on memory performance. The researcher controls the amount of sleep participants get (e.g., 4 hours, 6 hours, 8 hours). In this case, the sleep duration is the independent variable being manipulated.
2. Subject independent variables
Subject independent variables are those that naturally vary across participants. They cannot be manipulated by researchers and are used to categorize study participants into groups based on inherent characteristics.
Example: A study investigates the effect of age on reaction times of participants. Since the researcher cannot control or assign the age of participants, they are simply categorized into groups (e.g., young adults aged 18–30 years vs. older adults aged 60+). In this case, age is the subject independent variable.
Alternative Names for the Independent Variable
The independent variable is known by several names depending on the field and type of study. The table below shows the most common alternatives and the contexts in which they are typically used.
| Alternative Name | Context Where It Is Used |
| Predictor variable | Regression analysis and statistical modelling |
| Experimental variable | Controlled laboratory experiments |
| Manipulated variable | Experiments where the researcher actively changes a condition |
| Treatment variable | Clinical trials and intervention studies |
| Explanatory variable | Observational and correlational research |
| Input variable | Engineering, systems research, and applied sciences |
Understanding these alternative names matters in practice. When reading a published study, the methods section may refer to the independent variable by any of these terms depending on the discipline. Recognizing them as equivalent concepts helps you interpret research design accurately across fields.
How to Recognize an Independent Variable in a Study
Identifying the independent variable in an unfamiliar study is a skill that becomes easier with a consistent approach. The following three questions work as a practical checklist.
1. Is it manipulated or controlled by the researcher?
The independent variable is the one the researcher has decision-making power over. They choose its levels, assign participants to conditions based on it, or use it to divide the sample into groups. If the researcher decided what values it takes or which participants were exposed to which condition, it is almost certainly the independent variable.
Example: A researcher assigns one group of students to study with background music and another group to study in silence. The presence or absence of music is the independent variable because the researcher controls who gets which condition.
2. Does it occur before the outcome is measured?
The independent variable always precedes the dependent variable in time. Cause must come before effect. If one variable is the starting condition and the other is measured afterward in response, the variable that came first is the independent one.
Example: In a study on whether early childhood nutrition affects school performance at age 10, nutritional intake in early childhood is the independent variable because it precedes and potentially influences later academic outcomes.
3. Is it the suspected cause in the research question?
The research question itself usually signals which variable is independent. Look for the factor the study is designed to test. Phrases such as “the effect of X on Y,” “how X influences Y,” or “whether X causes Y” all point to X as the independent variable.
Example: In the question “Does the number of hours of sleep affect athletic performance?”, hours of sleep is the suspected cause and therefore the independent variable. Athletic performance is what is being observed in response.
If you can answer yes to all three questions for a given variable, it is the independent variable. If a variable is measured as a result of something else, changes in response to another factor, or represents the outcome the study is designed to explain, it is the dependent variable instead.
What Is a Dependent Variable?
A dependent variable is the factor that a researcher measures or observes during an experiment to see whether it changes in response to the independent variable. It represents the presumed effect in a cause-and-effect relationship, that is, the outcome the study is designed to explain.
In non-experimental research, the dependent variable is still the outcome of primary interest, even if no active manipulation has taken place. In the survey study on income and healthcare access, the level of healthcare access each participant reports is the dependent variable because it is what the researcher is trying to understand and explain.
A useful way to think about it: if the independent variable is the question the researcher is asking, the dependent variable is the answer the data provides.
What are the Types of Dependent Variables?
A dependent variable is what is measured or observed in response to the independent variable. Also referred to as the response variable or outcome variable, it is influenced by the independent variable under different conditions.
Dependent variables can be categorized into two types.
1. Continuous dependent variables
This type of dependent variable is measured numerically. They can represent any value within a given range and are measured on a continuous scale (e.g., temperature, distance, time, weight, or height).
Example: A study on the effect of exercise duration on weight loss. Here, the exercise duration (e.g., 30 minutes, 60 minutes, 90 minutes per session) is the independent variable and the weight loss measured in kilograms or pounds is the quantitative dependent variable measured over a period.
Since weight loss is recorded numerically and can have decimal values, it is a continuous dependent variable rather than a categorical one.
2. Categorical or discrete dependent variables
Categorical (or discrete) dependent variables are based on distinct categories or classifications rather than numerical values. They take on a limited number of possible values and are not measured on a continuous scale.
Examples of categorical dependent variables:
- Gender (Male/Female/Other)
- Exam results (Pass/Fail)
- Cholesterol levels (High/Low)
Example study: A researcher investigates how different types of advertisements influence consumer purchase decision. Here, the type of advertisement (e.g., social media ad, TV commercial, or print ad) is the independent variable and whether the consumer buys the product (Yes or No) is the dependent variable.
Because the purchase decision is classified into two distinct groups (Yes or No) rather than being measured on a continuous scale, it is a categorical (or discrete) dependent variable.
Alternative Names for the Dependent Variable
Like the independent variable, the dependent variable is referred to by different names across disciplines and research contexts. The table below lists the most common alternatives and where each tends to appear.
| Alternative Name | Context Where It Is Used |
| Outcome variable | Clinical trials, public health, and intervention research |
| Response variable | Statistics, regression analysis, and experimental design |
| Measured variable | General experimental research across sciences |
| Criterion variable | Psychology, psychometrics, and educational testing |
| Effect variable | Causal inference and structural equation modelling |
| Output variable | Engineering, systems research, and applied sciences |
As with independent variables, recognizing these alternative names is essential for reading research across disciplines. A clinical paper may describe the dependent variable as the “primary outcome,” while a statistics textbook discusses the same concept as the “response variable.” They refer to the same role in the study.
How to Recognize a Dependent Variable in a Study
The same three-question framework used to identify independent variables can be reversed to reliably identify dependent variables. If a variable fails the independent variable checklist, it is a strong candidate for being the dependent variable. The following three questions confirm it.
1. Is it measured or observed rather than controlled?
The dependent variable is never assigned or manipulated by the researcher. Instead, it is recorded as data after the study conditions have been set. If the researcher is collecting values for a variable rather than deciding what those values will be, it is the dependent variable.
Example: In a study testing whether different teaching methods improve reading speed, the researcher assigns participants to different teaching conditions (independent variable) and then measures how quickly each participant reads at the end of the study. Reading speed is the dependent variable because the researcher records it rather than controls it.
2. Does it occur after the independent variable and potentially in response to it?
The dependent variable is always measured after the independent variable has been introduced or established. It represents the outcome, not the starting condition. If a variable is assessed at the end of the study or after an intervention has taken place, it is likely the dependent variable.
Example: In a study on whether a mindfulness program reduces workplace stress, the mindfulness program is introduced first (independent variable) and stress levels are measured afterward (dependent variable). Stress is the dependent variable because it is assessed in response to the programme.
3. Is it the outcome the research question is trying to explain?
Research questions are framed around what the study is trying to understand or predict. The dependent variable is whatever that outcome is. In questions structured as “the effect of X on Y” or “how X influences Y,” Y is always the dependent variable.
Example: In the question “Does the frequency of exercise affect resting heart rate?”, resting heart rate is the dependent variable. It is the physiological outcome the researcher is tracking to see whether it responds to changes in exercise frequency.
If the variable is something that changes as a result of another factor, is recorded as data rather than assigned by the researcher, and represents the answer the study is designed to find, it is the dependent variable. A quick cross-check is to apply the sentence test: “(Independent variable) causes a change in (dependent variable)”. If the sentence reads logically in that direction and not in reverse, you have identified both variables correctly.
Difference Between Independent and Dependent Variables
Here’s a table summarizing the differences between independent and dependent variables.
|
One point worth noting on graph placement: by scientific convention, the independent variable is always plotted on the horizontal X-axis and the dependent variable on the vertical Y-axis. This convention holds across disciplines from biology to economics, and knowing it is a reliable way to identify each variable when reading charts or figures in published research.
Examples for Independent vs. Dependent Variables
Listed below are various research topics from different disciplines with their corresponding independent and dependent variables identified.
| Discipline | Research Question | Independent Variable | Dependent Variable |
| Political Science | What is the relationship between media coverage and public opinion during a political campaign? | Media coverage | Public opinion |
| Music Studies | How do different types of ambient music impact the mood of diners in a restaurant? | Ambient music | Diners’ mood |
| Education | What is the influence of parental involvement on student grades? | Parental involvement | Student grades |
| Health and Wellness | How does physical exercise relate to mental health? | Duration of physical exercise | Mental health |
| Environment and Sustainability | Do recycling programs impact household waste reduction? | Participation in recycling programs | Reduction in household waste |
| Communication Studies | What is the effect of social media on interpersonal communication? | Social media usage | Interpersonal communication skills |
| Criminal Justice and Law | Does the incorporation of police body cameras influence the use of force incidents? | Use of police body cameras | Use of force incidents |
| Film Studies | Does the genre of a film impact audience emotion? | Film genre | Audience emotion |
What Is a Controlled Variable? (And How It Differs)
A controlled variable, also called a constant variable or a control variable, is any factor in an experiment that the researcher deliberately keeps the same across all groups and conditions throughout the study. It is neither manipulated like the independent variable nor measured as an outcome like the dependent variable. Instead, it is held steady so that it cannot interfere with the results.
Example
In a study testing whether caffeine improves reaction time, controlled variables might include the time of day participants are tested, the temperature of the room, the amount of sleep participants had the night before, and the method used to measure reaction time. None of these are the focus of the study, but all of them could influence reaction time if left to vary freely. Controlling them removes their potential to distort the findings.
Learn more about confounding/controlled variables in this video by Dr. Monika Sobocan.
Why Controlled Variables Matter for Valid Research
The purpose of controlling variables is to ensure that any change observed in the dependent variable can be confidently attributed to the independent variable and nothing else. Without controlled variables, a study cannot establish a genuine cause-and-effect relationship. It can only identify a correlation, which may be produced by any number of unaccounted factors.
Controlling variables is what separates a well-designed experiment from one that produces unreliable or uninterpretable results. The more rigorously a study controls extraneous factors, the more confidently researchers can claim that the independent variable caused the observed change in the dependent variable.
Example of how control variables affect research
If a researcher tests a new teaching method on a class of 10 students and simultaneously changes the classroom layout, reduces class size, and increases lesson length, it becomes impossible to know which change produced any improvement in test scores. Each of those uncontrolled factors is a potential confounding variable, in other words, a source of alternative explanations that undermine the study’s conclusions.
Differences between independent, dependent, and controlled variables
The table below places all three variable types side by side to clarify how they differ in role and function.
| Feature | Independent Variable | Dependent Variable | Controlled Variable |
| Role in study | The cause being tested | The effect being measured | A potential interfering factor held constant |
| Researcher action | Manipulated or assigned | Measured and recorded | Kept the same across all conditions |
| Does it change during the study? | Yes, intentionally | Yes, in response to IV | No, by deliberate design |
| Appears in hypothesis? | Yes | Yes | Rarely, but may be noted in methods |
| Example (study testing whether caffeine affects reaction time) | Dose of caffeine given | Reaction time recorded | Time of day, room temperature, prior sleep |
Examples of independent, dependent, and controlled variables across disciplines
The table below consolidates examples across twelve disciplines, including a controlled variable for each to illustrate how all three variable types operate together in a single study.
| Discipline | Research Question | Independent Variable | Dependent Variable | Controlled Variable |
| Medicine | Does Drug A reduce blood pressure? | Drug dosage administered | Systolic blood pressure reading | Patient age, diet, existing medication |
| Education | Does class size affect test scores? | Number of students per class | Student test scores | Subject taught, teacher, school type |
| Psychology | Does sleep duration affect memory? | Hours of sleep per night | Number of words correctly recalled | Age, time of testing, prior caffeine intake |
| Biology | Does light intensity affect photosynthesis? | Light intensity level | Rate of oxygen production | Water temperature, CO2 concentration, plant species |
| Public Health | Does exercise reduce diabetes risk? | Frequency of aerobic exercise | Blood glucose levels | Diet, BMI, family history |
| Political Science | Does media exposure affect voter turnout? | Level of political media consumption | Voter turnout rate | Age, region, prior voting history |
| Economics | Does minimum wage increase affect employment? | Minimum wage level | Local employment rate | Industry sector, regional cost of living |
| Environmental Science | Does air pollution affect respiratory health? | Particulate matter concentration (PM2.5) | Incidence of respiratory illness | Age, smoking status, geographic area |
| Nutrition | Does breakfast consumption affect concentration? | Whether breakfast was eaten | Cognitive performance test score | Sleep duration, meal composition, time of testing |
| Communications | Does social media use affect interpersonal skills? | Daily hours of social media use | Self-reported communication quality | Age, occupation, baseline skill level |
| Criminal Justice | Do body cameras affect use-of-force incidents? | Whether officers wore body cameras | Number of use-of-force incidents recorded | Officer experience, precinct size, crime rate |
| Organisational Psychology | Does remote work affect employee productivity? | Work location (remote vs. in-office) | Output measured by tasks completed | Role type, years of experience, team size |
Independent and Dependent Variables in Research Design
Understanding what independent and dependent variables are is only the first step. Researchers need to understand how they function within the broader architecture of a study, from the hypothesis through to statistical analysis, so that they can design experiments that produce valid, reproducible, and meaningful results.
Role in Hypothesis Formulation
Every testable hypothesis in empirical research is built around the relationship between an independent variable and a dependent variable. The hypothesis states, in advance, what the researcher expects to observe in the dependent variable when the independent variable is changed or compared across conditions. This predictive structure is what makes a hypothesis falsifiable and therefore scientifically useful.
A well-formed hypothesis follows a consistent pattern: it names the independent variable, names the dependent variable, and states the direction or nature of the expected relationship between them.
Framing variables clearly at the hypothesis stage is not a formality. It determines the study design, the measurement tools required, the appropriate sample size, and the statistical tests that will be used. Vaguely defined variables at this stage propagate errors throughout the entire study.
Example of using independent and dependent variables in hypotheses
- Oncology: a researcher investigating a new checkpoint inhibitor might hypothesise: “Administration of anti-PD-1 antibody therapy will significantly reduce tumour volume in mice with implanted melanoma cells compared to untreated controls.”
- Here, the independent variable is the administration of anti-PD-1 antibody therapy, the dependent variable is tumour volume, and the hypothesis specifies both the expected direction of the effect (reduction) and the comparison condition (untreated controls).
- Immunology: a hypothesis might read: “Increasing concentrations of lipopolysaccharide (LPS) will produce a dose-dependent increase in TNF-alpha secretion by human macrophages in vitro.”
- The independent variable is LPS concentration, the dependent variable is TNF-alpha secretion, and the hypothesis predicts not just an effect but a specific dose-response pattern.
- Cardiology: a clinical hypothesis might state: “Patients receiving statin therapy for 12 weeks will show a greater reduction in LDL cholesterol levels than patients receiving a placebo.”
- The independent variable is treatment type (statin vs. placebo), the dependent variable is LDL cholesterol level, and the hypothesis is structured to support a randomised controlled trial design.
What is the null hypothesis?
Alongside the primary research hypothesis, most studies also specify a null hypothesis: the default assumption that the independent variable has no effect on the dependent variable. The goal of the statistical analysis is to determine whether the data provide sufficient evidence to reject this null hypothesis. In the statin example above, the null hypothesis would state that there is no significant difference in LDL cholesterol reduction between the statin and placebo groups.
How Independent and Dependent Variables Are Operationalized
Operationalization is the process of translating an abstract variable into a concrete, measurable definition. You are specifying exactly how the independent variable will be applied and exactly how the dependent variable will be measured. Without operationalization, a variable is a concept, not a scientific tool.
Why do independent and dependent variables need to be operationalized?
Poor operationalization is one of the most common sources of irreproducibility in biomedical research. If one laboratory defines “high-fat diet” as 45% kcal from fat and another uses 60% kcal from fat, results across studies will be inconsistent even when both claim to be studying the same independent variable. Precise operationalization is therefore not just a methodological requirement but a prerequisite for results that can be compared, replicated, and built upon.
Decisions needed to operationalize variables
In practice, operationalization requires two decisions for every variable: what it means in the context of this specific study, and how it will be quantified or categorised.
Consider the independent variable “immune stress” in a microbiology study. This term is too broad to act directly on. Operationalized, it might become “exposure to 10 ng/mL of LPS for 24 hours under standard in vitro culture conditions.” Every element of that definition (concentration, duration, conditions) removes ambiguity and makes the study replicable.
The same principle applies to dependent variables. “Immune response” is a concept. Operationalized, it might become “concentration of interleukin-6 (IL-6) in the culture supernatant measured by ELISA at the 24-hour time point.” This definition specifies what is being measured (IL-6), how it is being measured (ELISA), what biological material is being analysed (culture supernatant), and when the measurement is taken (24 hours).
Examples of operationalized independent and dependent variables
The table below shows how abstract variables in four biomedical fields are operationalized into measurable study components.
| Field | Abstract Independent Variable | Operationalized independent variable | Abstract Dependent Variable | Operationalized dependent variable |
| Oncology | Drug treatment | 10 mg/kg of cisplatin administered intraperitoneally every 48 hours for 14 days | Tumour response | Tumour volume (mm³) measured by caliper on day 14 |
| Immunology | Immune activation | Stimulation with 100 ng/mL LPS for 6 hours | Inflammatory response | IL-6 and TNF-alpha concentration (pg/mL) measured by multiplex ELISA |
| Microbiology | Antibiotic exposure | Treatment with 1 µg/mL ciprofloxacin for 24 hours | Bacterial survival | Colony-forming units (CFU/mL) counted on selective agar plates after 24 hours |
| Cardiology | Exercise intervention | Supervised aerobic exercise for 45 minutes, five days per week, for 12 weeks | Cardiovascular function | Resting heart rate (bpm) and ejection fraction (%) measured by echocardiography at week 12 |
Using Independent and Dependent Variables in Statistical Analysis
Once data has been collected, the relationship between the independent and dependent variables is examined through statistical analysis. The choice of statistical method depends on the nature of both variables (specifically, whether they are continuous, categorical, or binary) and on the number of independent variables included in the analysis.
The table below summarises the most common statistical approaches used in biomedical research based on variable type.
| Study Design | Independent Variable Type | Dependent Variable Type | Appropriate Statistical Method | Biomedical Example |
| Observational | Continuous | Continuous | Simple or multiple linear regression | Predicting LDL cholesterol from BMI and age |
| Experimental | Categorical (2 groups) | Continuous | Independent samples t-test | Comparing mean IL-6 levels between treated and untreated macrophages |
| Experimental | Categorical (3+ groups) | Continuous | One-way or two-way ANOVA | Comparing tumour volume across three drug dose groups |
| Observational or experimental | Continuous or categorical | Binary | Logistic regression | Predicting likelihood of antibiotic resistance based on prior exposure patterns |
| Clinical trial | Categorical | Time-to-event | Cox proportional hazards regression / Kaplan-Meier | Comparing overall survival between immunotherapy and chemotherapy arms |
| Repeated measures | Categorical | Continuous, measured over time | Repeated measures ANOVA or mixed-effects model | Measuring ejection fraction at baseline, 6 weeks, and 12 weeks across cardiac rehab groups |
Independent and dependent variables in qualitative research
The concepts of independent and dependent variables are most naturally at home in quantitative research, where variables are measured numerically and relationships between them are assessed using statistical methods. However, the underlying logic (that some factors influence others, and that research should be designed to investigate those relationships) also applies in qualitative research, albeit in a modified form.
In qualitative biomedical research, which is more common in areas such as patient experience, clinical communication, and healthcare delivery, the independent and dependent variable framework is less rigid. Researchers are more likely to speak of themes, phenomena, and factors of interest than of variables and measurements.
Example
- A qualitative study exploring how cancer patients experience immunotherapy side effects does not manipulate an independent variable or measure a dependent variable numerically. Instead, it investigates the factors that shape patient experience through interviews or observation, and presents findings as themes and categories rather than statistics.
- An ethnographic study of how a rural farming community in West Africa negotiates land ownership after the death of a patriarch does not manipulate an independent variable or measure a dependent variable. The researcher spends months embedded in the community, observes interactions, conducts unstructured interviews, and analyses the resulting data for patterns of social meaning, power, and cultural practice. There are factors of interest—gender, kinship structure, colonial land law, religious authority—but they are not operationalized as variables. They are treated as interacting, context-dependent forces that cannot be meaningfully reduced to numerical values without distorting the phenomena being studied.
- A grounded theory study examining how first-generation university students construct their academic identity does not assign an independent variable or measure an outcome. The researcher conducts in-depth interviews, codes the transcripts iteratively, and builds a theoretical model grounded in the participants’ own accounts of their experience. The study is concerned with process (how identity forms, shifts, and is negotiated) rather than with measuring the magnitude of an effect.
Mixed-methods research
Mixed methods research combines quantitative and qualitative methods.
Example of a mixed methods oncology study
An oncology team might conduct a randomised controlled trial measuring whether a new anti-nausea drug reduces chemotherapy-induced nausea severity scores. This is a fully quantitative study with a tightly defined IV and DV. The same team might simultaneously run a qualitative study interviewing patients about their lived experience of chemotherapy side effects, their strategies for managing nausea at home, and the impact of symptoms on their sense of self and daily functioning. The quantitative study tells the team how much the drug works. The qualitative study tells the team what that experience means to the people living through it, and why some patients discontinue treatment despite clinical benefit. Neither question is answerable using the other study’s methods.
Example of a mixed methods gerontology study
A quantitative study might use regression to demonstrate that reduced mobility is a significant predictor of depression in adults over 80: mobility is the independent variable, depression score on the Geriatric Depression Scale is the dependent variable. A companion qualitative study might then interview older adults with limited mobility about what the loss of independent movement means to them: how it alters their sense of identity, affects their relationships, changes their relationship with time and space. The quantitative study establishes the association. The qualitative study explains the human texture of that association.
Example of a mixed methods public health study
A qualitative health study on patient adherence to antiretroviral therapy in sub-Saharan Africa might combine quantitative tracking of pill counts and viral load measurements with in-depth interviews exploring the social, cultural, and economic factors that shape whether patients take their medication consistently. The quantitative arm uses adherence rate as the dependent variable and examines demographic and clinical predictors. The qualitative arm investigates the same phenomenon through narrative and observation, producing findings that explain patterns the numbers alone cannot account for: stigma, family secrecy, transportation barriers, the symbolic meaning of taking medication daily.
Should independent and dependent variables be used in qualitative research?
In qualitative work, the independent and dependent variable framework should be held lightly: it is useful as a way of clarifying what you are investigating and what you are trying to understand, but not imposed as a rigid structure on phenomena that are irreducibly complex, contextual, and meaning-laden. Forcing a qualitative research question into an IV/DV template does not make the study more rigorous. It makes the findings less honest.
See also: How to choose the research methodology best suited for your study
Conclusion
In academic research, understanding the independent and dependent variables helps structure experiments effectively to obtain meaningful results. Whether studying the impact of diet on health, teaching strategies on student performance, or marketing strategies on customer engagement, correctly identifying the independent and dependent variables is crucial for conducting valid and reliable research.
References
- Andrade, C. A Student’s Guide to the Classification and Operationalization of Variables in the Conceptualization and Design of a Clinical Study: Part 1. Available at: https://pubmed.ncbi.nlm.nih.gov/34376897/ DOI: 1177/0253717621994334
- Flanelly, L. et al. Independent, dependent, and other variables in healthcare and chaplaincy research. Available at: https://pubmed.ncbi.nlm.nih.gov/25255148/ DOI: 1080/08854726.2014.959374
- National Library of Medicine. Common Terms and Equations: Dependent and Independent Variables. Available at: https://www.nlm.nih.gov/oet/ed/stats/02-200.html
This article was originally published on April 18, 2023, and revised on May 24, 2026.