



Bio
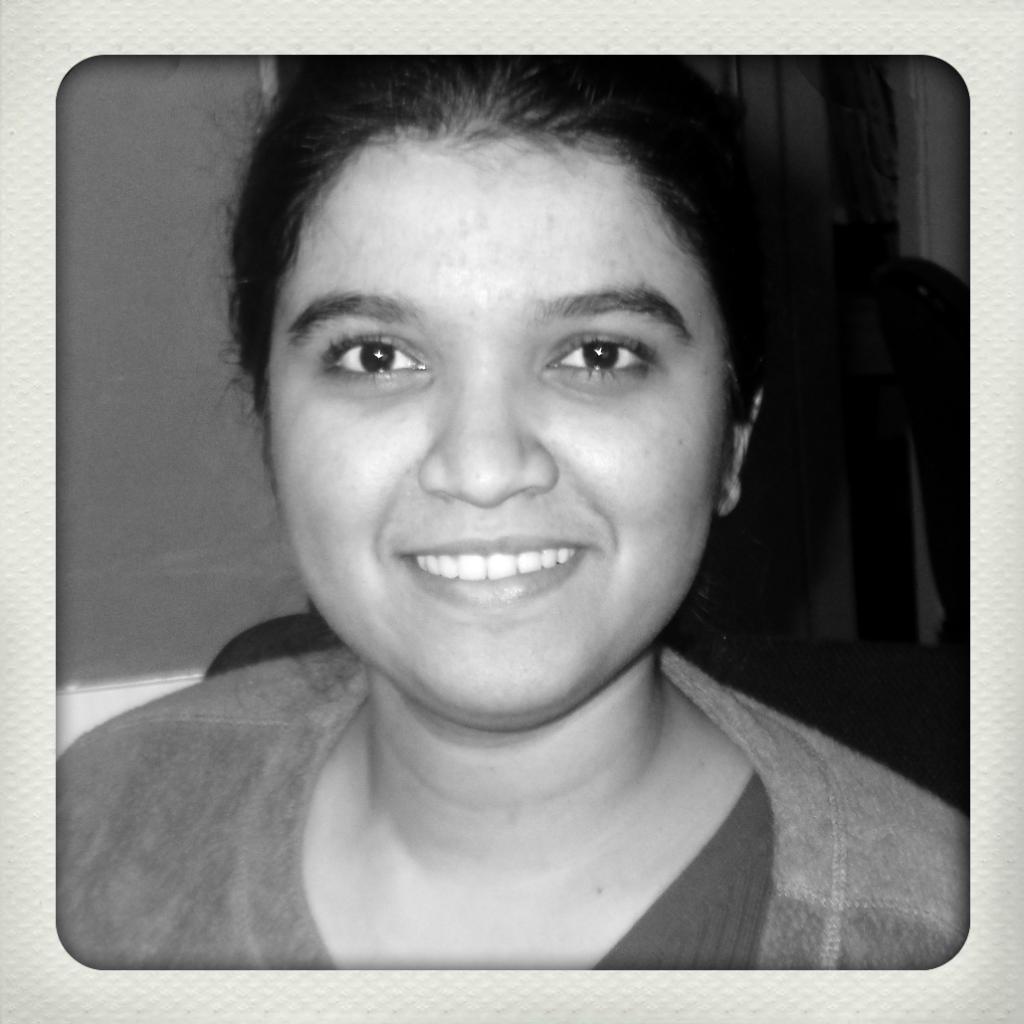
BA, ELS – Managing Editor. Marisha uses her language skills and knowledge of the best practices in the field of Psychology and Psychosocial Healthcare to help ESL authors produce clear, coherent, readable, and grammatically correct manuscripts, to meet the standards of leading journals in their field. She ensures that the needs of key accounts are met such as journals, universities and publishers and also oversees customized projects and solutions for these clients, in areas like alt-text writing and publication consultancy.
Subject Matter Expertise
This user is yet to add their areas of subject matter expertise.
