|
Getting your Trinity Audio player ready...
|
Contents
- Glossary of Key Terms
- Key Takeaways
- What Is a Confounding Variable?
- How Can You Tell If a Variable Is a Confounder?
- What Are Common Examples of Confounding Variables?
- Why Do Confounding Variables Matter?
- How Is Confounding Different From Effect Modification and Selection Bias?
- What Is the Difference Between a Confounder, a Mediator, and a Collider?
- How Do Researchers Identify Potential Confounders?
- What Methods Can Control for Confounding Variables?
- Why Are Experimental Studies Less Prone to Confounding Than Observational Studies?
- How Do Confounding Variables Affect UX and Product Research?
- What Criteria Define a Confounder in Epidemiology?
- How Does Confounding Show Up in Health and Social Research?
- What Are Common Mistakes When Dealing With Confounders?
- Frequently Asked Questions
This guide explains what confounding variables are, why they matter in research and real world data analysis, and how researchers, analysts, and UX professionals identify and control for them. It draws together concepts from epidemiology, experimental design, statistics, and applied user research.
Glossary of Key Terms
| Term | Definition |
| Confounding variable | A third factor that is related to both the independent variable and the dependent variable, and that distorts the apparent relationship between them. |
| Independent variable | The variable a researcher manipulates or treats as the presumed cause, sometimes called the exposure or predictor. |
| Dependent variable | The outcome being measured, sometimes called the response variable. |
| Extraneous variable | Any variable other than the independent variable that could influence the dependent variable; confounders are a subset of these. |
| Spurious relationship | An association between two variables that appears causal but is actually produced by a third, unaccounted for variable. |
| Selection bias | A distortion that arises because the people or units included in a study differ systematically from those not included. |
| Effect modifier (interaction) | A variable that changes the strength or direction of the relationship between the independent and dependent variable, rather than creating a false relationship. |
| Randomization | Randomly assigning participants to conditions so that confounders are, on average, evenly distributed across groups. |
| Stratification | Dividing data into subgroups based on a potential confounder and analyzing the relationship within each subgroup. |
| Matching | Pairing participants in different groups so that they are similar on key confounding variables. |
| Multivariate adjustment | Statistical techniques, such as regression, that estimate the effect of one variable while holding others constant. |
| Directed acyclic graph (DAG) | A diagram of assumed causal relationships used to identify which variables need to be controlled for. |
| Mediator | A variable that lies on the causal pathway between the independent and dependent variable, and should not be treated as a confounder. |
| Collider | A variable that is caused by both the independent and dependent variable; adjusting for it can introduce bias rather than remove it. |
| Internal validity | The degree to which a study accurately demonstrates a cause and effect relationship without interference from outside factors. |
Key Takeaways
- A confounding variable is linked to both the variable being studied as a cause and the outcome, and it can create a false or misleading association between them.
- Confounding is one of the main threats to internal validity in observational research, alongside selection bias and information bias.
- Randomized experiments reduce confounding because random assignment tends to balance both known and unknown confounders across groups.
- In observational studies, common control methods include restriction, matching, stratification, and statistical adjustment such as multiple regression.
- Not every related variable is a confounder. Mediators and colliders look similar but should be handled differently, and adjusting for them incorrectly can introduce bias.
- Directed acyclic graphs help researchers map assumed causal relationships and decide which variables to adjust for.
- In UX and product research, confounders such as device type, time of day, or user experience level can make A/B test results misleading.
- Reporting potential confounders and how they were handled is considered good practice for transparency in published research.
What Is a Confounding Variable?
A confounding variable is an outside factor that is related to both the variable a study treats as a cause and the variable it treats as an outcome, and it can make the two appear connected even when they are not, or hide a real connection.
In formal terms, a confounder must meet three conditions.
- First, it must be associated with the independent variable, sometimes called the exposure.
- Second, it must independently influence the dependent variable, or outcome.
- Third, it must not simply be a step on the causal path between the exposure and the outcome, since a variable on that path is a mediator rather than a confounder.
A classic illustration involves ice cream sales and drowning incidents. Both tend to rise in summer, so a naive analysis might suggest that buying ice cream causes drowning. The real explanation is warm weather, which increases both ice cream sales and swimming, and therefore drowning risk. Warm weather is the confounding variable.
Why Does the Word “Confound” Fit?
The term comes from the idea of mixing things together so they cannot be separated. When a confounder is present, the effect of the variable being studied is mixed together with the effect of the confounder, so the two cannot be told apart using the data alone.
Other Names Used for the Same Idea
Different fields use slightly different vocabulary for closely related ideas:
- Lurking variable: a term often used in introductory statistics for an unmeasured variable influencing the apparent relationship.
- Third variable problem: a general label for the situation where an unconsidered factor explains a correlation.
- Confounding factor or confounding bias: terms common in epidemiology and clinical research.
- Nuisance variable: sometimes used in experimental psychology, though this term can also refer to sources of unwanted variability that are not necessarily confounders.
How Can You Tell If a Variable Is a Confounder?
A variable is likely a confounder if it changes along with your main predictor, also predicts your outcome on its own, and is not simply a result of either one. All three conditions generally need to be true.
A practical checklist for evaluating a candidate variable:
- Is it associated with the exposure or independent variable in your data or in prior research?
- Does it have a plausible, independent effect on the outcome, separate from the exposure?
- Does it occur before the exposure in time, or could it logically influence the exposure?
- Is it not simply a consequence of the exposure itself, which would make it a mediator rather than a confounder?
- Is it not simply a consequence of the outcome, which would make it a collider?
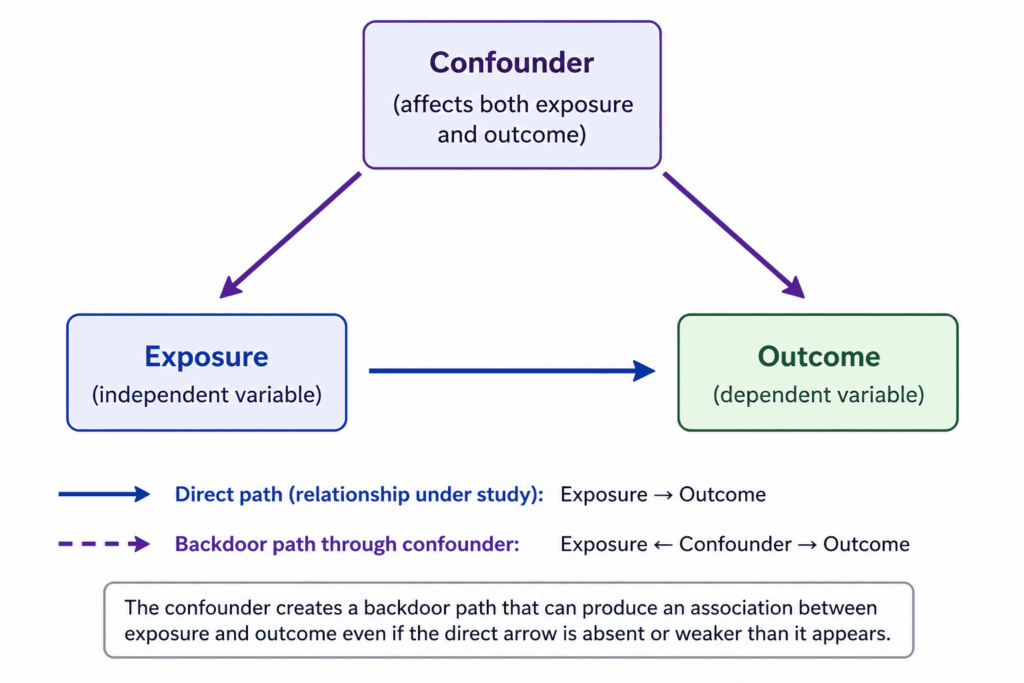
A Simple Diagram in Words
Picture three boxes. The exposure box has an arrow pointing to the outcome box, representing the relationship under study. The confounder box has an arrow pointing to the exposure box and a separate arrow pointing to the outcome box. Because the confounder feeds into both, it creates a backdoor path that can produce an association between exposure and outcome even if the direct arrow between them does not exist or is weaker than it appears.
What Are Common Examples of Confounding Variables?
Confounding shows up across health research, social science, and business analytics. The table below lists frequently cited examples.
| Apparent relationship | Possible confounder | Why it confounds |
| Coffee drinking and heart disease | Smoking | People who drink more coffee may also smoke more, and smoking independently raises heart disease risk. |
| Birth order and Down syndrome | Maternal age | Maternal age tends to increase with birth order and is itself linked to the chance of certain chromosomal conditions. |
| Ice cream sales and drowning rates | Outdoor temperature | Hot weather increases both ice cream purchases and swimming, which raises drowning risk. |
| Bottle feeding and infant illness | Household income or hygiene access | Families with fewer resources may be more likely to bottle feed and also face higher exposure to contaminated water. |
| Vitamin use and longevity | Overall health consciousness | People who take vitamins may also exercise more, eat better, and visit doctors more often. |
| City crime rate and ice cream truck presence | Season or temperature | Both crime and ice cream sales can rise in warmer months for unrelated reasons. |
| Shoe size and reading ability in children | Age | Older children tend to have larger feet and better reading skills, with age driving both. |
Why Do Confounding Variables Matter?
Confounding variables matter because they can lead researchers, businesses, and policymakers to draw the wrong conclusions about cause and effect, sometimes with serious consequences.
Consequences of uncontrolled confounding include the following:
- Overestimating or underestimating the true effect of an exposure or intervention.
- Reporting a relationship that does not exist at all, known as a spurious association.
- Masking a real relationship so it appears weaker than it actually is, sometimes called negative confounding.
- Leading to wasted resources if a program or product change is rolled out based on a misleading result.
- Undermining the internal validity of a study, which limits how confidently its findings can be applied elsewhere.
Confounding is one of several threats to internal validity. Others include information bias, which arises from errors in how variables are measured, and selection bias, which arises from how participants enter or remain in a study. Confounding is distinct from both, because it concerns a real third variable that distorts an otherwise correctly measured association.
How Is Confounding Different From Effect Modification and Selection Bias?
Confounding, effect modification, and selection bias are all sources of misleading results, but they arise in different ways and call for different solutions.
Confounding Versus Effect Modification
A confounder distorts the overall estimate of a relationship by being linked to both variables. An effect modifier, also called an interacting variable, does not distort the overall estimate in the same way. Instead, it changes the size or direction of the effect across different subgroups.
For example, a medication might reduce blood pressure more in younger patients than in older patients. Age here is an effect modifier, because the true effect genuinely differs by age group, rather than creating a false overall association.
| Feature | Confounder | Effect modifier |
| Relationship to exposure | Associated with the exposure | May or may not be associated with the exposure |
| Relationship to outcome | Independently affects the outcome | Changes how strongly the exposure affects the outcome |
| How it is handled | Adjusted for or controlled to remove its influence | Reported separately for each subgroup, often called stratified analysis |
| Effect on results | Can create or hide an association | Reveals that the association genuinely varies by subgroup |
Confounding Versus Selection Bias
Selection bias occurs when the way participants are recruited or retained in a study causes the sample to be unrepresentative, which can distort results even before any confounder is considered.
A useful distinction is that confounding is about the relationships among variables within the data, while selection bias is about how the data came to be collected in the first place. Both can occur in the same study, and both reduce internal validity, but the fixes differ. Confounding is addressed through study design or statistical adjustment, while selection bias is addressed through how participants are recruited, sampled, and followed up.
What Is the Difference Between a Confounder, a Mediator, and a Collider?
A confounder is a common cause of both exposure and outcome, a mediator sits on the path between exposure and outcome, and a collider is a common effect of both, and each requires a different analytic decision.
Mediators
A mediator is a variable through which the exposure exerts its effect on the outcome. For example, if a stressful job increases cortisol levels, and elevated cortisol increases blood pressure, then cortisol is a mediator between job stress and blood pressure. Adjusting for a mediator in a simple analysis can remove part of the very effect a researcher is trying to study, so mediators are usually analyzed with specialized methods rather than treated like confounders.
Colliders
A collider is a variable that is influenced by both the exposure and the outcome. Adjusting for a collider can open up a spurious association between exposure and outcome where none existed before, a phenomenon sometimes called collider bias. Because of this, researchers are cautioned not to adjust for every variable that happens to correlate with both the exposure and outcome without first thinking through the underlying causal structure.
How Do Researchers Identify Potential Confounders?
Researchers identify potential confounders by combining subject matter knowledge, prior literature, and statistical checks for association with both the exposure and the outcome.
Common approaches include:
- Reviewing existing literature to see which variables have previously been linked to the outcome under study.
- Drawing a directed acyclic graph that maps out assumed causal relationships among the exposure, outcome, and other variables, then using it to decide which variables sit on backdoor paths that need to be blocked.
- Checking, within the collected data, whether a candidate variable differs across exposure groups and whether it is also associated with the outcome.
- Consulting subject-matter experts, since some confounders are well known within a field even if they are not obvious from the data alone.
- Considering timing, since a true confounder generally needs to occur before, or at the same time as, the exposure.
Why Statistical Significance Alone Is Not Enough
A common mistake is to test whether a variable is statistically associated with the outcome and, if not significant, conclude it cannot be a confounder. This approach is unreliable, especially in smaller samples, because a true confounder may fail to reach statistical significance by chance. Decisions about which variables to treat as confounders should rely primarily on substantive knowledge of the subject area, with data checks used to support, not replace, that judgment.
What Methods Can Control for Confounding Variables?
Confounding can be addressed at two stages: while designing a study, and while analyzing the data afterward, and most well designed studies use a combination of both.
Design Stage Methods
- Randomization: randomly assigning participants to groups so that, on average, both measured and unmeasured confounders are evenly distributed.
- Restriction: limiting the study population to people with the same or similar value of the confounder, such as studying only nonsmokers when investigating another exposure linked to lung disease.
- Matching: pairing participants across groups so that each pair is similar on key confounders, such as matching by age and sex.
- Blinding: while primarily aimed at other biases, blinding can also reduce confounding that arises from differences in how participants or researchers behave once they know the group assignment.
Analysis Stage Methods
- Stratification: analyzing the relationship between exposure and outcome separately within levels of the confounder, then combining the results.
- Standardization: adjusting rates so that groups being compared have the same distribution of a confounder, often used when comparing populations with different age structures.
- Multivariable regression: statistically estimating the effect of the exposure on the outcome while holding other variables constant.
- Propensity score methods: estimating the probability that a unit would receive the exposure based on observed characteristics, then using that score to match, weight, or stratify the analysis.
- Sensitivity analysis: assessing how strong an unmeasured confounder would need to be to change the conclusions of a study.
| Method | When it is applied | Main limitation |
| Randomization | Design stage, experimental studies | Not possible for many exposures that cannot be ethically or practically assigned |
| Restriction | Design stage | Reduces generalizability and can shrink the available sample |
| Matching | Design or analysis stage | Can be difficult with many confounders, and may discard unmatched cases |
| Stratification | Analysis stage | Becomes impractical with many confounders or small subgroup sizes |
| Regression adjustment | Analysis stage | Can only adjust for confounders that were measured and correctly modeled |
It is important to note that no analytic method can fully correct for confounders that were never measured. This is sometimes called residual or unmeasured confounding, and it is one reason that well designed randomized experiments are generally considered stronger evidence for causal claims than observational studies.
Why Are Experimental Studies Less Prone to Confounding Than Observational Studies?
Experimental studies use random assignment to create groups that are similar on average across every characteristic except the one being manipulated, which tends to neutralize confounders without needing to identify them in advance.
In an observational study, the researcher does not assign the exposure. Instead, participants arrive with their exposure status already determined by their own choices, circumstances, or history. Because of this, exposed and unexposed groups often differ systematically in ways that are related to the outcome, which is precisely the situation that produces confounding.
Despite this advantage, randomized experiments are not always feasible or ethical, particularly when studying harmful exposures, rare outcomes, or long-term effects. Observational studies remain essential in these cases, which is why methods for identifying and adjusting for confounders are so important in fields such as epidemiology and social science.
A Note on Sample Size
Randomization tends to balance confounders only on average and across large samples. In small studies, randomization can still result in groups that differ noticeably on important variables purely by chance, sometimes called chance confounding. Researchers sometimes use stratified randomization to reduce this risk by ensuring balance on key variables from the start.
How Do Confounding Variables Affect UX and Product Research?
In UX research, confounding variables can make it look like a design change caused a shift in user behavior, when the real cause is something else happening at the same time, such as a season, a marketing campaign, or a difference in who saw each version.
Examples of confounders commonly seen in UX and product analytics include:
- Time of testing: running a test for the original design in one period and the new design in another period, when external events differ between the two periods.
- Device or browser differences: if one version of a design is, even unintentionally, shown more often to mobile users and the other to desktop users.
- User experience level: new users and returning users often behave differently regardless of which design they see.
- Traffic source: users arriving from an email campaign may behave differently than users arriving from search, independent of the design itself.
- Novelty effects: users may respond to a design simply because it is new, not because it is better, which can confound short term results.
How UX Researchers Reduce Confounding
- Running A and B versions at the same time, rather than sequentially, so external events affect both groups equally.
- Randomly assigning users to versions so that device type, traffic source, and experience level are balanced across groups.
- Checking that the groups being compared are similar on key characteristics before analyzing the outcome.
- Running tests for long enough to reduce the influence of short term novelty effects and day to day fluctuations.
What Criteria Define a Confounder in Epidemiology?
In epidemiology, a variable is generally treated as a confounder if it is associated with the exposure in the source population, is an independent risk factor for the outcome, and is not strictly an intermediate step between exposure and outcome.
These three criteria are often summarized as follows:
- Association with exposure: the variable’s distribution differs across exposure groups.
- Association with outcome: the variable predicts the outcome even among people who are not exposed.
- Not on the causal pathway: the variable is not simply a consequence of the exposure that then leads to the outcome.
Some researchers add a fourth, more conceptual criterion, which is that a true confounder should not itself be affected by the exposure or the outcome, since this would change its role to that of a mediator or collider rather than a confounder.
Confounding by Indication
A specific and important type of confounding in clinical research is confounding by indication. This occurs when the reason a treatment is given is itself linked to the outcome. For example, if doctors tend to prescribe a stronger medication to patients who are already sicker, then comparing outcomes between treated and untreated patients may make the medication look harmful, when in fact the underlying illness severity is driving the result.
How Does Confounding Show Up in Health and Social Research?
Confounding is a recurring concern in studies that link lifestyle factors, treatments, or social conditions to health and behavioral outcomes, because people who differ on the exposure of interest often differ on many other things as well.
| Field | Typical confounding concern | Common approach used |
| Clinical research | Patients who receive a treatment may differ in severity of illness from those who do not | Randomized controlled trials, propensity score matching |
| Nutrition research | People who eat a certain food often differ in overall diet quality and lifestyle | Adjustment for diet quality indices and lifestyle factors |
| Education research | Students in certain programs may differ in prior achievement or family background | Matching on prior test scores, regression adjustment |
| Workplace studies | Employees who use a certain benefit may differ in job tenure or role | Stratification by tenure or role, comparison groups |
What Are Common Mistakes When Dealing With Confounders?
The most common mistakes are failing to think about confounders before data collection, adjusting for variables that are actually mediators or colliders, and assuming that statistical adjustment can fix poorly designed studies.
- Treating every variable correlated with the outcome as a confounder, without checking whether it is also associated with the exposure.
- Adjusting for a mediator, which can remove part of the genuine effect being studied.
- Adjusting for a collider, which can introduce a spurious association rather than remove one.
- Assuming that a large sample size protects against confounding, when in fact sample size mainly affects precision, not bias.
- Failing to consider confounders that were not measured, and therefore cannot be adjusted for using standard statistical methods.
- Reporting only the adjusted result without describing which variables were adjusted for and why, which limits readers’ ability to judge the analysis.
Frequently Asked Questions
Is a confounding variable the same as a lurking variable?
Yes, in most introductory statistics contexts the two terms are used interchangeably. Both describe an unaccounted for variable that influences the apparent relationship between two other variables, though some sources reserve confounding variable for cases where the third variable’s effect can be at least partly modeled.
Can a confounding variable ever be a good thing to find?
Yes. Discovering an unexpected confounder can reveal a more accurate or more interesting explanation for a pattern in the data, and can point toward new questions worth investigating, even though it complicates the original analysis.
How many confounders should a study control for?
There is no fixed number. The goal is to identify the confounders that are most plausible given subject matter knowledge, rather than to control for as many variables as possible, since adjusting for unnecessary variables, especially mediators or colliders, can introduce new problems.
Does a larger sample size remove confounding?
No. A larger sample size improves the precision of an estimate and reduces the role of random chance, but it does not correct for a systematic bias such as confounding. A very large study can produce a very precise but still biased result if confounders are not addressed.
Can confounding variables apply to surveys and self reported data, not just experiments?
Yes. Self-reported data is especially prone to confounding because respondents who differ on the behavior being asked about, such as exercise habits, often differ on many related habits at the same time, such as diet, sleep, or income, any of which could independently affect the outcome being studied.
What is the difference between a confounder and a covariate?
A covariate is a general term for any variable included in an analysis alongside the main variable of interest. A confounder is a specific type of covariate that meets the criteria of being related to both the exposure and the outcome. Not all covariates are confounders, and some covariates are included for other reasons, such as improving precision.
Why do people sometimes say correlation does not equal causation in relation to confounding?
This phrase is often used because confounding is one of the main reasons a correlation between two variables may not reflect a direct causal relationship. A correlation can arise because one variable causes the other, because the relationship runs in the opposite direction, or because a third variable, the confounder, influences both.
How is confounding handled differently in machine learning compared to traditional statistics?
The underlying concept is the same, but machine learning models trained on observational data can pick up on confounded relationships just as readily as traditional statistical models, sometimes called spurious correlations or shortcut learning. Techniques such as causal inference methods, careful feature selection, and testing models on data from different conditions are increasingly used to check whether a model has learned a genuine relationship or one driven by a confounder in the training data.

Comment