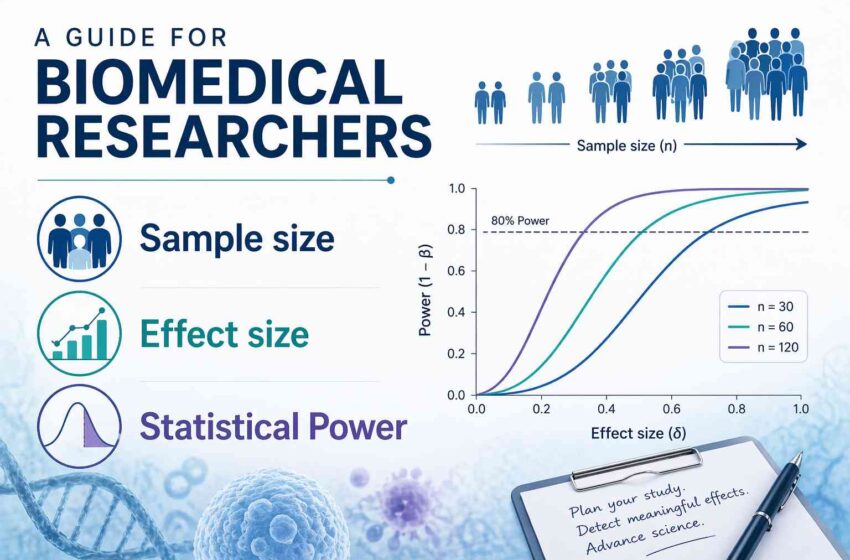
Infographic: What is statistical power? How to calculate sample size, effect size, and power

Key Takeaways
- Sample size determination is essential planning, not an afterthought
- Three factors drive sample size: effect size, power desired, and significance level. Optimize effect size when possible because it’s often more efficient than increasing sample size.
- Always justify effect size assumptions using published evidence, pilot data, or expert input
- Use prospective power analysis before data collection, never retrospectively
- Account for realistic challenges: dropout, clustering, unequal groups
- When standard formulas don’t apply, use simulation-based approaches
- Document how study constraints (cost, feasibility) influenced your design choices
- Power calculations are inherently hypothetical; they’re only as good as your effect size assumptions
Jump to Contents
- What is Sample Size?
- What Is Effect Size?
- What is Statistical Power?
- What’s the Relationship Between Type I and Type II Errors?
- How Do Sample Size, Effect Size, and Power Connect?
- How Do You Calculate Sample Size?
- Common Study Design Scenarios
- Cluster Sampling and Multilevel Studies
- How Should You Handle Missing Data?
- Why Is Retrospective Power Analysis Problematic?
- When Should You Use Power Simulation?
- How Do You Choose Between Options?
- What Resources Help With Power Calculations?
- Common Mistakes When Calculating Sample Size and Effect Size
What is Sample Size?
Sample size refers to the number of participants or observations (denoted as n) included in a study. This seemingly simple number plays a fundamental role in determining whether your research conclusions will be reliable. When you can’t study an entire population, you select a sample and use it to draw inferences about the larger group.
Consider a study of a new diabetes treatment. Rather than tracking every diabetic patient worldwide, researchers recruit a manageable sample of 300 patients. This number, 300, is the sample size. The key challenge is determining how many participants you actually need.
Why Should You Care About Sample Size?
Sample size affects two critical properties of any study: the precision of your estimates and the power to detect real effects. Larger samples generally produce more precise estimates with smaller margins of error, following a mathematical principle known as the law of diminishing returns, i.e., at some point, adding more participants produces minimal gains.
Conversely, samples that are too small may fail to detect a real treatment effect, leading to false negative results. A study comparing a new antihypertensive medication with a placebo might miss a clinically important blood pressure reduction if enrollment is inadequate. This represents a waste of research resources and, worse, the loss of potentially helpful information for patients.
What Is Effect Size?
Effect size measures the magnitude of a treatment effect or the strength of a relationship between variables. It answers the question: “How big is the difference?” Rather than just asking “Does this treatment work?” effect size tells us “How much does it work?”
Effect sizes come in many forms depending on your analysis type:
| Study Type | Effect Size Measure | Example |
| Comparing means (continuous data) | Cohen’s d | Difference in weight loss between two diet groups |
| Chi-squared tests | Cohen’s w | Difference in cancer rates between treatment arms |
| Comparing proportions | Cohen’s h | Difference in cure rates (80% vs. 70%) |
| Correlation studies | Pearson’s r | Association between cholesterol and heart disease |
| ANOVA/regression | Cohen’s f² | Effect of multiple drug doses on blood glucose |
Biomedical researchers often face a practical challenge: how do you know what effect size to expect? The answer typically comes from three sources: pilot studies you’ve conducted, published literature, or expert consensus about what constitutes clinical significance.
For instance, a clinical trial examining zinc supplementation for diarrhea in HIV-positive children might review existing studies showing zinc reduces diarrhea episodes by 30-50%. This published evidence informs your effect size assumption for planning your new study.
What is Statistical Power?
Power is the probability that your study will detect a statistically significant effect if that effect truly exists in the population. In other words, it’s the ability to avoid a false negative result (called a Type II error). Conventional power targets 80%, meaning researchers want an 80% probability of detecting their hypothesized effect.
Power depends on four interrelated factors:
- Sample size (larger n increases power)
- Effect size (larger effects are easier to detect)
- Statistical significance level α (usually 0.05)
- The specific statistical test you’ll use
What’s the Relationship Between Type I and Type II Errors?
Understanding these error types clarifies power:
Type I Error (α):
You conclude an effect exists when it actually doesn’t (false positive). This is the significance level, which is conventionally set at 0.05, meaning a 5% chance of falsely declaring significance.
Type II Error (β):
You conclude no effect exists when it actually does (false negative). Power = 1 − β. If power is 80%, then beta is 0.20 (20% chance of missing a real effect).
A clinical trial testing a new heart failure medication illustrates these errors. A Type I error would declare the drug beneficial when it isn’t. A Type II error would fail to recognize a genuinely effective treatment.
How Do Sample Size, Effect Size, and Power Connect?
The Mathematical Relationship
The fundamental principle: these three elements cannot vary independently. Once you fix any three, the fourth is determined. Here’s the typical scenario:
You specify:
- Desired power (usually 80%)
- Significance level α (usually 0.05)
- Hypothesized effect size (from pilot data or literature)
- Statistical test you’ll use
The calculation determines: the required sample size
This process, called a priori power analysis, happens before data collection.
A Practical Example
Consider designing a study comparing zinc supplementation to placebo for reducing diarrhea in children with HIV infection. Suppose previous studies suggest zinc reduces diarrheal episodes by approximately 30-50% compared to placebo.
Using the proportions from prior studies:
- Control group: 8 episodes per 100 days
- Zinc group: 5 episodes per 100 days
- Effect size (difference): clinically meaningful reduction
- Desired power: 80%
- Significance level: 0.05
Through power calculation software (such as PASS, G*Power, or R), researchers determine that approximately 100 children per group are needed for adequate power to detect this effect size.
How Do You Calculate Sample Size?
Information you need
Before performing sample size calculations, gather:
- Clear study hypotheses (null and alternative)
- Your planned statistical test
- Hypothesized effect size with justification
- Acceptable Type I error rate (α)
- Desired power level
- Estimated population parameters (like standard deviation for continuous variables)
The specific formula depends on your study design. A two-sample t-test comparing means requires different calculations than a chi-squared test comparing proportions.
What is Standard Error?
Standard error determines precision. For a study estimating a single proportion, the standard error is √[p(1-p)/n]. Suppose you want to estimate the proportion of patients responding to a new depression treatment with a standard error of no more than 3% (0.03). If you hypothesize p = 0.60:
SE = √[0.60 × 0.40/n] ≤ 0.03
Solving: n ≥ 533 participants
Common Study Design Scenarios
Estimating a Single Parameter
You want to estimate a population characteristic with specified precision. For example, estimating the average hemoglobin level in a patient population to within ±1 g/dL.
Approach: Set your desired standard error and solve for n. The formula is n = (σ/SE)², where σ is the population standard deviation. With an estimated σ = 2.5 g/dL and desired SE = 1:
n = (2.5/1)² = 6.25, so roughly 7 participants (though this assumes normal distribution—real studies would need more)
Comparing Two Groups
Most biomedical research compares treatment versus control. Here, power depends on:
- Size of difference between groups
- Variability within groups
- Whether group sizes are equal
- Whether measurements are independent or paired
For comparing two group means with equal sample sizes in each group and equal variances, the required sample per group is:
n = 2(σ²)(2.8/Δ)²
where Δ is the hypothesized difference and 2.8 comes from the combination of the 95% confidence interval requirement (1.96) and 80% power (0.84).
Sensitivity and Specificity Studies
Diagnostic test validation requires careful power considerations. A sensitivity of 80% means the test correctly identifies 80% of truly positive individuals; specificity of 90% means it correctly identifies 90% of truly negative individuals.
For these studies, sample size calculations account for the prevalence of disease. A biomedical example: validating a biomarker for pain assessment requires calculating sample sizes separately for pain patients and pain-free controls based on the expected sensitivity and specificity values.
Cluster Sampling and Multilevel Studies
Why Clustering Complicates Sample Size Calculations
Many biomedical studies have natural clustering: patients within hospitals, students within schools, measurements within individuals. This violates the independence assumption of simple sample size formulas.
The impact is captured by the intraclass correlation coefficient (ICC), which measures how similar units within the same cluster are. With ICC = 0, clustering has no effect. As ICC increases, units within clusters become more similar, reducing the effective information gained per observation.
- The practical consequence: studies with clustering require larger samples to achieve the same power as unclustered designs.
Formula Adjustment for Cluster Designs
Standard error for cluster sampling:
SE(ȳ) = √[σ²/n + σ²ₐ/J] = √[(σ²/n)[1 + (m-1)ICC]]
where J is number of clusters, m is observations per cluster, and ICC is the intraclass correlation.
In a hospital-based study examining patient satisfaction across 20 hospitals with 15 patients per hospital (n=300 total), if ICC = 0.05, the effective sample size is much less than 300 because observations within hospitals are correlated.
How Should You Handle Missing Data?
Accounting for Dropout and Attrition
Real studies experience dropout. Participants withdraw, become unavailable, or fail to complete follow-up. This reduces effective sample size below what you enrolled.
If you anticipate 20% dropout in a longitudinal study, you must inflate your calculated sample size accordingly. If calculations suggest 200 participants are needed and you expect 20% loss:
Sample to enroll = 200/0.80 = 250 participants
Where Should Dropout Estimates Come From?
Review literature on similar studies. If no studies match your population, consider:
- Severity of the condition (sicker patients may have higher dropout)
- Duration of follow-up (longer studies have more attrition)
- Participant burden (intensive studies lose more participants)
- Financial incentives offered
Conservative practice estimates dropout toward the high end when data are uncertain.
Why Is Retrospective Power Analysis Problematic?
The Post-hoc Power Calculation Trap
Never calculate power after seeing your data based on the observed effect size. This common mistake, called retrospective or post-hoc power analysis, is statistically misleading.
Here’s why: if your study failed to find statistical significance, calculating power using the small observed effect size will yield low power, but this is just describing the failure you already know about. It provides no valid information about what would happen in a new study.
Likewise, if your study found significance, post-hoc power calculations often show “excellent” power, but this is circular reasoning since you already achieved statistical significance.
The Correct Approach
Use prospective (a priori) power analysis before conducting your study, basing effect size on external evidence, not on preliminary data from your current study.
When Should You Use Power Simulation?
Advantages of Simulation-Based Approaches
Complex study designs may lack standard power calculation formulas. Examples include:
- Studies with irregular missing data patterns
- Nonlinear relationships
- Complex multilevel structures
- Unequal group sizes
- Adaptive designs
Simulation-based power analysis involves:
- Generate artificial data matching your hypothesized population
- Analyze each simulated dataset using your planned statistical method
- Record the p-value for each analysis
- Repeat 1000+ times
- Power = proportion of simulations with p < 0.05
Example
Suppose you’re designing a longitudinal study of CD4 counts in HIV-positive children comparing treatment versus control, with measurements at irregular intervals and anticipated dropout. Existing formulas don’t handle this complexity. You can instead:
- Fit a multilevel model to pilot data
- Specify treatment effects and variance parameters
- Simulate datasets varying sample sizes
- Determine which sample size yields ≥80% power
How Do You Choose Between Options?
Practical Constraints: Cost and Feasibility
Sample size is never purely a statistical matter. Budget limitations, participant availability, and operational constraints matter.
Questions to ask:
- What’s the cost per participant?
- How long can the study last?
- How many sites can you recruit from?
- What’s realistically achievable?
Sometimes the largest statistically sound sample is infeasible. A power calculation suggesting 500 participants may be unrealistic if your clinic sees only 30 eligible patients monthly. In these situations, document your constraints clearly and explain the implications for power in your report.
Balancing Multiple Hypotheses
Grant proposals often include multiple research aims with different power requirements. Base your sample size calculation on the primary (most important) hypothesis. Secondary hypotheses may achieve reduced power.
What Resources Help With Power Calculations?
| Software/Tool | Type | Use Case |
| G*Power | Stand-alone | General-purpose, many statistical tests |
| PASS | Commercial | Comprehensive, specialized designs |
| R (pwr package) | Free | Flexible, programmable |
| nQuery+nTerim | Commercial | Complex designs, group sequential trials |
| Online calculators | Web-based | Quick reference for common tests |
Common Mistakes When Calculating Sample Size and Effect Size
- Using default software settings without understanding assumptions. Many statistical software packages (G*Power, PASS, online calculators) have preset defaults for parameters like the significance level or the distribution type, but these may not match your specific study design or research question. Blindly accepting defaults can lead to sample sizes that are either inadequate or wastefully large, and your actual study may violate the assumptions the software made.
- Assuming a large effect size without evidence. Researchers sometimes hypothesize large effects (like Cohen’s d = 0.8) hoping to keep sample sizes manageable, but if the true effect is actually smaller, your study will be underpowered and likely fail to detect the true relationship. This practice wastes resources and leads to false negative findings that might discourage future research on potentially beneficial interventions.
- Ignoring dropout when calculating required sample size. Many sample size calculations assume complete data, but real studies experience participant attrition, missed appointments, and data loss. If you plan for 100 participants but expect 25% dropout, you actually have only 75 evaluable subjects, falling short of your power requirement without enrolling additional buffer participants upfront.
- Failing to account for clustering in multilevel designs. Hospital-based studies, school-based interventions, and longitudinal studies have natural clustering that violates independence assumptions in standard formulas, effectively reducing power. Ignoring this correlation structure can lead to drastically underpowered studies that appear adequate on paper but fail to detect real effects.
- Applying post-hoc power calculations inappropriately. Calculating power after a study is complete based on observed effect sizes provides no valid information about the study’s design quality and is often misinterpreted as justifying inadequate sample sizes. This retroactive reasoning cannot inform decision-making and misleads readers about whether the study was properly powered.
- Choosing sample sizes based primarily on convenience rather than power requirements. Some researchers enroll as many participants as available resources allow without ensuring this number provides adequate power for their primary hypothesis. This approach may yield studies that are either wastefully large or dangerously underpowered, neither of which serves good science.
All these mistakes can seriously undermine research conclusions and waste participants’ time and research resources.
How Does Power Relate to Confidence Intervals?
Power and confidence interval width are closely related. An 80% powered study to detect a particular effect size will typically yield confidence intervals that exclude the null value about 95% of the time (for continuous outcomes with two-sided 0.05 significance level).
More precisely, for a confidence interval approach to power: the true effect must be at least 2.8 standard errors from the null hypothesis (the sum of 1.96 for the 95% interval plus 0.84 for the 80th percentile) for 80% power.
This perspective emphasizes that adequate power ensures not just statistical significance but also clinically meaningful precision in your estimates.
Frequently Asked Questions
How do I justify my sample size to a peer reviewer or IRB?
Reviewers and ethics boards want to see that your sample size wasn’t arbitrary. A strong justification typically covers four things:
- The primary outcome and its statistical test: state exactly what you’re testing (e.g., difference in mean HbA1c between two groups using an independent t-test)
- Your effect size estimate and its source: cite a prior study, meta-analysis, or pilot data. Never say “we assumed a medium effect.” Say “based on Woxypoxy et al. (2021), who reported a Cohen’s d of 0.45 for a similar intervention, we assumed…”
- Your chosen α and power levels: 0.05 and 80% are conventional but you must state them; for Phase III trials or high-stakes decisions, 90% power is increasingly expected.
- Adjustments made: dropout rate, clustering correction, unequal group sizes. Show the math (e.g., “we inflated by 20% to account for expected attrition, yielding a final enrollment target of N = 120”).
- The software used: name it: G*Power 3.1, PASS 2023, R pwr package, etc.
A one-paragraph sample justification in a methods section might look like: “Sample size was calculated using G*Power 3.1. Based on a meta-analysis of similar interventions (Smith et al., 2022, d = 0.50), and assuming α = 0.05 (two-tailed) and 80% power for an independent samples t-test, we required 64 participants per group. Anticipating 15% attrition, we targeted enrollment of 76 per group (total N = 152).”
Why is my post-hoc power so low even though my result was statistically significant?
This confuses many researchers and is worth understanding clearly.
When a study finds a significant result, the observed effect in the data is almost always larger than the true population effect, because small studies only reach significance when they happen to catch an unusually large effect (this is sometimes called the “winner’s curse”). If you then calculate post-hoc power using that inflated observed effect size, the calculation becomes circular and misleading.
| Scenario | What you see | Why it’s misleading |
| Study is significant, post-hoc power is high | Power = 92% | You already knew it was significant so this adds nothing |
| Study is significant, post-hoc power is low | Power = 34% | Paradoxical but possible when the observed effect was just barely large enough to cross α = 0.05 |
| Study is non-significant, post-hoc power is low | Power = 18% | This is “observed power” and it just redescribes the non-significant result, not whether the study was adequately designed |
The core problem: post-hoc power calculated from the observed effect size is mathematically equivalent to a transformation of the p-value. It tells you nothing new. If your study was significant, use confidence intervals to characterize precision. If it was non-significant, report the range of effects for which you had adequate power to detect (a “sensitivity analysis” approach), rather than calculating power after the fact.
How do underpowered studies inflate effect sizes in published literature?
This is one of the most important and underappreciated problems in biomedical research.
The chain of events works like this:
- Step 1: Many small, underpowered studies are conducted on a given question
- Step 2: Most find no significant result and are never published (publication bias)
- Step 3: The few that do reach significance did so partly by luck, i.e., they happened to catch an effect that looked larger than it really is
- Step 4: Only these inflated effects make it into journals
- Step 5: Later researchers read those papers and use those inflated effect sizes to power their studies, thus building the bias forward
The practical consequence is that the “true” effect in biomedical literature is often 30–50% smaller than what published studies report. A review of meta-analyses across neuroscience, psychiatry, and somatic disease found that roughly 50% of individual studies had statistical power in the 0–20% range, well below the conventional 80% minimum.
What this means for your own work:
- When pulling effect sizes from a single prior study to power your research, treat them as upper bounds, not central estimates
- Where possible, base your effect size on a meta-analytic estimate rather than a single study
- Consider powering for an effect 25–30% smaller than the published estimate as a conservative hedge
How do I calculate sample size for logistic regression or survival analysis?
These two designs come up constantly in biomedical research.
For logistic regression:
The simplest rule of thumb is 10–20 events per predictor variable (EPV). So if you have 5 predictor variables and expect a 20% outcome rate, you need at least 250 participants (50 events ÷ 5 predictors × 10 EPV). For formal power analysis:
| Approach | Tool | What you need |
| Events per variable rule | Manual calculation | Number of predictors, expected outcome prevalence |
| Hsieh et al. formula | G*Power → “Logistic regression” | Odds ratio, exposure prevalence, α, power |
| Simulation-based | R simglm or pwrss package | Full model specification |
For survival analysis (time-to-event):
Sample size here is driven by the number of events, not total participants. The formula requires:
- The hazard ratio you want to detect (analogous to effect size)
- Expected event rate and follow-up time
- Censoring rate (participants who leave before the event occurs)
The key insight: a study with 1,000 participants but only 40 events is underpowered; a study with 200 participants and 180 events may be well-powered. Tools for this include PASS, the R survSurv package, and the pwr2ppl package for more complex designs.
When should I use 90% power instead of 80%?
The 80% convention is just a convention, not a law. Here’s when to consider going higher:
| Situation | Recommended power | Rationale |
| Phase III clinical trial (regulatory submission) | 90% | FDA/EMA guidance often expects 90%; underpowering is a common reason for rejection |
| High-stakes screening test validation | 90–95% | Missing a true positive has serious clinical consequences |
| Definitive confirmatory study | 90% | One-shot opportunity; replication is costly or impossible |
| Exploratory/pilot study | 70–80% | Lower bar is acceptable; purpose is to estimate effect size for a later study |
| Study with multiple primary endpoints | 80–90% per endpoint | Multiple comparisons corrections reduce effective power |
| Very cheap per-participant cost | 90%+ | When adding participants is easy, there’s little reason not to over-power |
Increasing power from 80% to 90% typically increases required sample size by roughly 25–35%, depending on the effect size and test type. The jump from 90% to 95% adds another ~20%.
When are Cohen’s effect size benchmarks inappropriate?
Cohen’s benchmarks (small = 0.2, medium = 0.5, large = 0.8 for Cohen’s d) were derived from behavioral science research in the 1960s and are widely misapplied in biomedical contexts.
The benchmarks are inappropriate when:
- Clinical significance differs from the statistical benchmark. A drug that reduces systolic blood pressure by 2 mmHg may have a “small” Cohen’s d but be clinically irrelevant; one reducing it by 12 mmHg may be clinically vital even if it’s “medium” statistically
- The outcome is rare or the measurement is noisy. In rare disease trials, even a Cohen’s d of 0.2 might be a breakthrough; in a noisy psychological scale, a d of 0.8 might be noise
- Your field has established norms. Many specialties have their own conventions. Oncology often uses hazard ratios; cardiology uses absolute risk reduction or NNT. Use the metric your field actually reports
- You’re doing a meta-analysis: use domain-specific evidence, not generic labels
What to use instead:
- A clinically meaningful difference agreed upon with domain experts (the “minimum clinically important difference” or MCID)
- Effect sizes from prior studies in your specific condition, population, and measurement instrument
- Pilot study estimates, with a conservative adjustment for likely inflation
What’s the difference between one-tailed and two-tailed tests for power calculations, and which should I use?
| Two-tailed (two-sided) | One-tailed (one-sided) | |
| Hypothesis tested | The intervention has any effect (either direction) | The intervention has an effect in a specific, pre-specified direction |
| Required sample size | Larger | Smaller (~20% fewer participants for the same power) |
| Default in biomedical research? | Yes | Rarely; requires strong prior justification |
| Acceptable use cases | Most clinical trials, most comparative studies | Non-inferiority trials; situations where an effect in the opposite direction is clinically impossible or irrelevant |
| Risk of misuse | None — it’s the default | Researchers sometimes switch to one-tailed post-hoc to reach significance; reviewers watch for this |
The practical rule: default to two-tailed unless your protocol explicitly pre-specifies a directional hypothesis with a scientific rationale. Regulatory agencies (FDA, EMA) typically require two-sided tests for primary endpoints. If a reviewer questions your choice, it’s much harder to justify a one-tailed test.
What sample size rules of thumb exist for multivariate methods and SEM?
Standard power formulas don’t apply to structural equation modeling (SEM), factor analysis, or mixed models cleanly. The most widely cited practical guidance:
| Method | Common rule of thumb | Better approach |
| Multiple regression | 10–20 participants per predictor | Formal power analysis with R² effect size in G*Power |
| Factor analysis (EFA) | 5–10 participants per item, minimum N = 200 | Simulation or MacCallum et al. (1999) communality-based method |
| Structural equation modeling (SEM) | N = 200 absolute minimum; 10–20 per free parameter | Monte Carlo simulation in Mplus or lavaan + simsem in R |
| Multilevel / mixed models | 30 groups × 30 individuals is a rough floor | Simulation via simr package in R; depends heavily on ICC |
| Mediation analysis | N ≥ 400 for small indirect effects | Bootstrap power via MBESS or MedPower in R |
The key insight with all these methods: the “rule of thumb” gets you to the starting line; simulation gets you to the right answer. Monte Carlo power analysis involves generating thousands of synthetic datasets matching your hypothesized model, fitting the model to each, and counting how often the key parameter reaches significance. It handles complexity that formulas can’t.
References
- Muhammad LN. Guidance on conducting sample size and power calculations. Applied Statistics Seminar Series, Northwestern University Department of Preventive Medicine; 2022. https://www.preventivemedicine.northwestern.edu/docs/applied-statistics-presentation-materials/sample-size-and-power-presentation.pdf
- Institute for Work & Health. Sample size and power. What researchers mean by… series; 2008. https://www.iwh.on.ca/what-researchers-mean-by/sample-size-and-power
- McBurney MK. Power and sample size. Common mistakes in using statistics: Spotting and avoiding them. University of Texas at Austin; 2011. https://web.ma.utexas.edu/users/mks/statmistakes/powersamplesize.html
This article was originally published on October 3, 2023, and revised on May 25, 2026.
An introduction to sample size effect size and statistical power for biomedical researchers.png