Contents
- Key Takeaways
- Glossary of Key Terms
- Introduction
- Where Meta-Analysis Sits in the Evidence Hierarchy
- Definition and Core Concepts
- What a Meta-Analysis Aims to Answer
- Meta-Analysis vs. Systematic Review
- Why Some Systematic Reviews Do Not Include a Meta-Analysis
- What is Aggregate Data (AD) Meta-Analysis?
- Other Types of Meta-Analysis: Pairwise, Network, Single-Group, Cumulative, IPD, DTA
- Types of Research Questions Addressed by Meta-Analysis
- How to Conduct a Meta-Analysis: Step-by-Step
- Forest Plots: Reading the Signature Output of Meta-Analysis
- Advantages and Limitations of Meta-Analysis
- Reporting Standards: PRISMA and Transparent Practice
- What Software Tools can be used for Meta-Analysis?
- Applications of Meta-Analysis Across Disciplines
- Frequently Asked Questions
Key Takeaways
- A meta-analysis is a statistical method that combines the quantitative results of multiple independent studies on the same research question to produce a single, more reliable estimate of effect size.
- It sits near the top of the evidence hierarchy, above individual randomised controlled trials (RCTs), systematic reviews, and observational studies.
- The term was coined in 1976 by statistician Gene V. Glass, who defined it as “the analysis of analyses.”
- A meta-analysis always occurs within or alongside a systematic review, but not all systematic reviews include a meta-analysis.
- The core statistical output is a pooled effect size (e.g., Cohen’s d, odds ratio, risk ratio, Pearson’s r) accompanied by a confidence interval.
- Two main statistical models are used: the fixed-effects model (assumes one true effect) and the random-effects model (assumes effects vary across studies).
- Heterogeneity (variation in results across studies) is assessed using Cochran’s Q test and the I² statistic, and must be explored before conclusions are drawn.
- Forest plots visually represent individual study results and the pooled estimate, making them the signature output of any meta-analysis.
- Publication bias—the tendency for positive results to be published more often than null results—is a major threat that must be assessed using funnel plots or statistical tests.
- Transparent reporting under the PRISMA guidelines (Preferred Reporting Items for Systematic Reviews and Meta-Analyses) is the accepted standard for publication.
- Meta-analysis is used across medicine, psychology, education, economics, and marketing to inform policy, clinical guidelines, and future research directions.
Glossary of Key Terms
| Term | Definition |
| Cochran’s Q Test | A statistical test used to assess whether the variation in effect sizes across included studies is greater than would be expected by chance, signaling heterogeneity. |
| Cohen’s d | A standardized effect size measure for continuous outcomes, expressing the difference between two group means in standard deviation units. |
| Confidence Interval (CI) | A range of values within which the true population parameter is estimated to lie, typically at the 95% confidence level. |
| Effect Size | A numerical measure of the magnitude and direction of a relationship or difference between variables. Common metrics include Cohen’s d, odds ratio, risk ratio, and Pearson’s r. |
| Fixed-Effects Model | A meta-analytic model that assumes all included studies estimate the same underlying true effect size, with differences attributable only to sampling error. |
| Forest Plot | A graphical display of the individual study effect sizes and the pooled summary estimate in a meta-analysis, typically showing confidence intervals as horizontal lines. |
| Funnel Plot | A scatter plot of individual study effect sizes against a measure of study precision (e.g., standard error), used to detect publication bias; asymmetry in the plot suggests bias. |
| Hedges’ g | A corrected version of Cohen’s d that adjusts for bias introduced by small sample sizes. |
| Heterogeneity | The degree of statistical or clinical variability in results across the included studies, which must be assessed before pooling results. |
| I² Statistic | A measure expressing the percentage of total variability in effect size estimates that is due to between-study heterogeneity (0–100%); values above 50% are generally considered substantial. |
| Inclusion/Exclusion Criteria | Pre-specified rules that determine which studies are eligible for inclusion in a meta-analysis, based on factors such as study design, population, intervention, and outcome. |
| Odds Ratio (OR) | An effect size metric for binary outcomes, expressing the ratio of the odds of an event in one group relative to another. |
| PICO Framework | A structured approach for framing clinical research questions: Population, Intervention, Comparison, Outcome. |
| PRISMA | Preferred Reporting Items for Systematic Reviews and Meta-Analyses; a widely accepted checklist and flow diagram for transparent reporting of evidence syntheses. |
| Publication Bias | The tendency for studies with statistically significant or positive findings to be published more readily than null or negative findings, skewing the evidence base. |
| Random-Effects Model | A meta-analytic model that assumes the true effect size varies across studies, accounting for both within-study (sampling) and between-study variability. |
| Risk Ratio (RR) | Also called relative risk; a ratio comparing the probability of an event in an exposed group versus an unexposed group. |
| Sensitivity Analysis | A secondary analysis that tests how robust the main findings are when key assumptions or inclusions are changed (e.g., excluding low-quality studies). |
| Subgroup Analysis | An analysis that examines whether the overall effect size differs across specific subgroups of studies or participants (e.g., by age, sex, study design). |
| Systematic Review | A structured, comprehensive synthesis of all available research on a specific question, following a pre-defined protocol; it may or may not include a meta-analysis. |
| Trim-and-Fill Method | A technique for adjusting the pooled effect size estimate when publication bias is detected, by imputing hypothetical missing studies. |
| Weighted Mean Effect Size | The overall effect size produced in a meta-analysis, where each study’s contribution is weighted by its precision (typically the inverse of its variance). |
Introduction
When policy-makers, clinicians, educators, or business leaders need to make evidence-informed decisions, a single study is rarely sufficient. Individual studies differ in sample sizes, methodologies, populations studied, and contexts. Their results can conflict, creating confusion rather than clarity. Meta-analysis addresses this challenge directly: it is a formal statistical procedure for aggregating the findings of multiple independent studies on the same research question, transforming a collection of sometimes inconsistent findings into a single, more precise estimate.
The word “meta” comes from Greek, meaning “after” or “beyond”. A meta-analysis is literally an analysis of previous analyses — a higher-order synthesis that operates on the results of primary studies rather than on raw participant data.
First named and formalized by statistician Gene V. Glass in 1976, meta-analysis has since become one of the most influential methods in scientific research. Glass originally applied the technique to the field of psychotherapy research, demonstrating that psychotherapy was more effective than no treatment by pooling data across hundreds of studies. Today, meta-analyses appear in virtually every scientific discipline, from medicine and public health to education, psychology, economics, and marketing.
Where Meta-Analysis Sits in the Evidence Hierarchy
The evidence hierarchy, sometimes depicted as a pyramid, ranks research designs by the strength of evidence they can provide. Meta-analysis occupies the highest tier alongside systematic reviews.
| Level | Study Type |
| 1 (Highest) | Systematic Reviews and Meta-Analyses |
| 2 | Randomised Controlled Trials (RCTs) |
| 3 | Cohort Studies |
| 4 | Case-Control Studies |
| 5 | Cross-Sectional Studies |
| 6 | Case Reports and Expert Opinion |
| 7 (Lowest) | Anecdotal Evidence |
The reason meta-analysis is ranked so highly is that by mathematically combining the results of many studies, it reduces the influence of random variation and provides a more statistically powerful test of the research hypothesis than any single study can offer.
Definition and Core Concepts
A meta-analysis is a quantitative research synthesis method that uses statistical techniques to combine and analyze the numerical results of multiple independent studies on a specific research question. Its primary output is a pooled effect size: a single number that summarises the magnitude and direction of the effect across all included studies. Pooled effect size is accompanied by a confidence interval and measures of statistical precision.
Three characteristics define a rigorous meta-analysis:
- It is conducted systematically, following a pre-registered protocol and transparent inclusion criteria.
- It requires multiple quantitative results from independent studies that share a sufficiently similar research question, population, intervention, and outcome.
- It is built on formal statistical analysis, not narrative description alone.
What a Meta-Analysis Aims to Answer
The two fundamental questions a meta-analysis seeks to answer are:
- What is the overall direction and magnitude of the effect across all available relevant studies?
- How consistent or variable are the findings across studies, and if they vary, why?
Beyond these core questions, a meta-analysis can also:
- Identify moderator variables that explain differences in effect sizes across studies.
- Detect publication bias or other systematic distortions in the literature.
- Guide the design of future primary studies by identifying gaps in the evidence base.
- Provide quantitative evidence to inform clinical guidelines, public policy, or business strategy.
Meta-Analysis vs. Systematic Review
Meta-analysis and systematic review are closely related but distinct concepts. Understanding the difference is essential for interpreting published research.
A systematic review is a structured, comprehensive overview of all available evidence on a specific research question. It involves a rigorous and transparent search strategy, pre-defined inclusion and exclusion criteria, quality appraisal of each study, and a synthesis of the findings, which may be narrative or statistical.
A meta-analysis is the statistical component of that synthesis. When a systematic review pools numerical data from included studies using statistical methods to produce a summary effect size, it incorporates a meta-analysis.
The key relationship: all meta-analyses require a systematic review to identify and quality-appraise the input studies, but not all systematic reviews contain a meta-analysis.
| Feature | Systematic Review | Meta-Analysis |
| Primary purpose | Comprehensively identify and appraise all relevant evidence | Statistically pool quantitative results to produce an overall effect size |
| Output type | Narrative summary (may include tables) | Quantitative: pooled effect size, confidence interval, forest plot |
| Data handled | Qualitative and/or quantitative | Quantitative only |
| Always includes statistical pooling? | No | Yes |
| Requires pre-defined protocol? | Yes | Yes |
| Can stand alone? | Yes | No — must be embedded in a systematic review |
| When not feasible | When no adequate studies exist | When studies are too heterogeneous to pool validly |
| Key tool for quality appraisal | CASP checklists, Cochrane RoB, GRADE | Same as systematic review, plus heterogeneity tests |
Why Some Systematic Reviews Do Not Include a Meta-Analysis
Not every systematic review can or should include a statistical pooling step. The main reasons why a meta-analysis may be inappropriate include:
- Substantial heterogeneity: If the included studies differ too widely in populations, interventions, outcome measures, or methodologies, combining them may produce a misleading summary (the “apples and oranges” problem).
- Too few studies: A meta-analysis on two or three studies is unlikely to be reliable or informative.
- Inconsistent outcome measurement: If studies do not measure outcomes in comparable ways, a common effect size metric may be impossible to derive.
- Poor study quality: Including methodologically weak studies risks producing a biased pooled estimate (“garbage in, garbage out”).
What is Aggregate Data (AD) Meta-Analysis?
The most widely practised form of meta-analysis, and the implicit default when researchers refer to “meta-analysis” without further qualification. Rather than working with raw participant-level data, aggregate data meta-analysis extracts summary statistics like means, standard deviations, event counts, odds ratios, correlation coefficients, directly from published study reports and pools them statistically.
How it works:
- A single summary effect size (and its standard error or confidence interval) is extracted or calculated for each included study.
- These study-level estimates are weighted by their precision and combined into a pooled effect size using either a fixed-effects or random-effects model.
- The entire analysis operates on one row of data per study, not one row per participant.
What is extracted from each study:
- Sample sizes (total, and per group where applicable)
- Means and standard deviations (for continuous outcomes)
- Event counts and totals (for binary outcomes)
- Reported effect sizes and confidence intervals
- Study design characteristics used for quality assessment and subgroup analyses
Advantages:
- Data are almost always available from published papers without requiring author contact or data-sharing agreements.
- Far less resource-intensive than IPD meta-analysis to plan, execute, and obtain regulatory or ethics approval for.
- Suitable for the vast majority of research questions where study-level summary statistics are sufficient.
- Supported by all major meta-analysis software packages and well-established reporting guidelines (PRISMA).
Limitations:
- Dependent entirely on what authors chose to report; outcome-reporting bias and selective reporting directly limit what can be extracted.
- Subgroup analyses can only be conducted at the study level (e.g., comparing studies that enrolled mostly older adults versus younger adults), not at the individual participant level.
- When studies report outcomes differently (e.g., different scales, time points, or definitions), harmonisation requires assumptions that introduce uncertainty.
- Cannot re-examine or correct errors in the original analyses.
Other Types of Meta-Analysis: Pairwise, Network, Single-Group, Cumulative, IPD, DTA
Meta-analysis is not a single, uniform method. Several distinct variants have been developed to address different research questions, data structures, and evidence-base configurations. The table below provides a quick-reference overview before each type is described in detail.
| Type | Core Purpose | Key Feature |
| Pairwise Meta-Analysis | Compare two conditions (intervention vs. control) | Standard pooled effect size; most common form |
| Network Meta-Analysis | Compare three or more interventions simultaneously | Includes indirect comparisons via a common comparator |
| Individual Patient Data (IPD) Meta-Analysis | Pool raw participant-level data across studies | Most precise; enables subgroup and time-to-event analyses |
| Single-Group (Single-Arm) Meta-Analysis | Estimate prevalence or incidence in a single population | No comparator; pools proportions or rates |
| Cumulative Meta-Analysis | Track how pooled evidence evolves as studies accumulate over time | Studies added sequentially in chronological order |
| Diagnostic Test Accuracy (DTA) Meta-Analysis | Synthesise the sensitivity and specificity of a diagnostic test | Bivariate or HSROC models; no single effect size metric |
Pairwise Meta-Analysis
The most common and foundational form. It compares exactly two conditions: typically an intervention versus a control, or two competing treatments. It produces a single pooled effect size.
- Studies must share a common comparator (e.g., placebo, usual care, no treatment).
- Effect size metrics include Cohen’s d, odds ratio (OR), risk ratio (RR), or hazard ratio (HR), depending on outcome type.
- Results are displayed in a forest plot with a summary diamond.
- Both fixed-effects and random-effects models apply.
- All other meta-analysis types described below are extensions of, or departures from, this foundational design.
Network Meta-Analysis (NMA)
Also called mixed treatment comparison (MTC) meta-analysis or multiple treatment comparison meta-analysis. NMA extends the pairwise framework to simultaneously compare three or more interventions, even when direct head-to-head trial evidence does not exist for every pair.
How it works:
- Studies are mapped into a “network” of evidence, where each node represents an intervention and each edge represents a direct comparison made in at least one study.
- If Drug A has been compared to Placebo, and Drug B has been compared to Placebo, NMA can infer the relative effect of Drug A vs. Drug B, an indirect comparison.
- When both direct and indirect evidence exist for the same comparison, NMA combines them into a mixed estimate.
Key concepts:
| Concept | Meaning |
| Transitivity | The assumption that studies connected indirectly are sufficiently similar in patient mix and design to make the indirect comparison valid |
| Consistency | Agreement between the direct and indirect evidence for the same comparison; inconsistency is a key threat to NMA validity |
| League table | A matrix displaying all pairwise comparisons from the network, typically with probability rankings |
| Surface Under the Cumulative Ranking (SUCRA) | A probability score (0–100%) ranking interventions from worst to best on the outcome |
When to use NMA:
- Multiple competing treatments exist but head-to-head trials are absent or sparse.
- Decision-makers need to rank treatments (e.g., selecting a first-line therapy from several options).
- Common in pharmacology, clinical guideline development, and health technology assessment.
Limitation:
Transitivity cannot be statistically tested. It must be justified clinically and methodologically. Inconsistency in the network can invalidate the indirect comparisons.
Individual Patient Data (IPD) Meta-Analysis
Considered the gold standard of meta-analytic methods. Rather than extracting aggregate summary statistics from published papers, IPD meta-analysis collects the raw, participant-level dataset from each primary study and re-analyses them under a unified statistical model.
Advantages over aggregate data meta-analysis:
- Enables consistent outcome definition and time-point selection across studies.
- Allows subgroup analyses at the individual level (e.g., by age, sex, comorbidity) rather than at the study level.
- Handles time-to-event data (survival analysis) more accurately.
- Can correct for errors or inconsistencies in the original published analyses.
- Reduces outcome-reporting bias because researchers work with the raw data rather than published summaries.
Challenges:
- Requires data-sharing agreements and ethical approvals from each contributing study team.
- Substantially more resource-intensive to obtain, harmonize, and quality-check individual datasets.
- Not all study teams will consent to share data; non-response can introduce selection bias.
- Data harmonization (aligning variable definitions, units, and coding conventions across studies) is time-consuming.
Common applications:
Cancer survival studies, cardiovascular risk prediction, vaccine efficacy across demographic subgroups.
Single-Group (Single-Arm) Meta-Analysis
Used when there is no comparator. That is, when the goal is to estimate a prevalence, incidence rate, or other proportion in a defined population rather than to compare two groups.
- Pools proportions or rates across studies using an appropriate transformation (e.g., Freeman-Tukey double arcsine transformation, logit transformation) to stabilize variance.
- Common outputs: pooled prevalence of a diagnosis, pooled incidence of an adverse event, pooled rate of a behavior.
- Particularly prevalent in epidemiology (e.g., prevalence of depression in nurses), public health, and nursing research.
- Heterogeneity is almost always high in prevalence meta-analyses, making the random-effects model the default choice.
- Interpretation requires care: the pooled prevalence is a statistical average, not a universally applicable figure.
Cumulative Meta-Analysis
A cumulative meta-analysis adds studies one at a time, typically in chronological order of publication. It then recalculates the pooled effect size after each addition. The result is a sequence of forest plots or a single plot with rolling summary lines.
Primary uses:
- Determining the point in time at which accumulated evidence first reached statistical significance or clinical meaningfulness, i.e., retrospectively identifying when a treatment “should” have become standard of care.
- Monitoring whether a pooled effect size remains stable as more evidence accumulates (stability analysis).
- Detecting whether early small studies produced inflated effect sizes that were subsequently attenuated by larger, more rigorous trials (a pattern linked to publication bias and small-study effects).
Limitation
Cumulative meta-analysis is primarily a retrospective and exploratory tool. It should not be used as a sequential testing framework without appropriate alpha-spending adjustments, as repeated significance testing inflates the Type I error rate.
Diagnostic Test Accuracy (DTA) Meta-Analysis
A specialized form designed to synthesize evidence on the performance of a diagnostic test, screening tool, or biomarker. Unlike standard meta-analysis, there is no single effect size metric. Test accuracy is characterized jointly by sensitivity (the proportion of true positives correctly identified) and specificity (the proportion of true negatives correctly identified).
Key features:
| Feature | Detail |
| Primary metrics | Sensitivity, specificity, positive likelihood ratio (LR+), negative likelihood ratio (LR−), diagnostic odds ratio (DOR) |
| Statistical model | Bivariate random-effects model (Reitsma) or Hierarchical Summary ROC (HSROC) model |
| Output | Summary ROC curve with a summary operating point (pooled sensitivity and specificity) |
| Threshold effect | Different studies often use different cut-off values for a positive result, introducing a specific form of heterogeneity unique to DTA reviews |
| Key software | Stata (metandi), R (mada, reitsma), RevMan |
Common applications:
Evaluating imaging modalities (e.g., MRI for a specific condition), blood or urine biomarkers, clinical scoring systems, and screening questionnaires.
Important distinction from standard meta-analysis:
Because sensitivity and specificity are negatively correlated across studies (a higher cut-off increases specificity but reduces sensitivity), they must be modelled jointly rather than pooled separately. Failure to do so produces biased and misleading results.
Types of Research Questions Addressed by Meta-Analysis
Meta-analysis can address a broad range of quantitative research questions across disciplines. The research question must be specific, well-defined, and answerable from existing empirical studies. The PICO framework (Population, Intervention, Comparison, Outcome) is widely used in clinical and health research to structure eligible questions.
| Question Type | Example |
| Treatment efficacy | Does cognitive behavioral therapy (CBT) reduce depression severity more than medication in adults? |
| Intervention effectiveness | Do mentoring programs improve academic attainment in secondary school students? |
| Risk factors and associations | Is long-term shift work associated with an increased risk of cardiovascular disease? |
| Dose-response relationships | Is there a linear association between sedentary time and all-cause mortality? |
| Prevalence rates | What percentage of adults worldwide meet the diagnostic criteria for generalized anxiety disorder? |
| Impact of policies | What is the effect of minimum wage increases on employment levels? |
| Comparative effectiveness | Which antihypertensive drug class produces the greatest reduction in stroke risk? |
| Psychological constructs | Is self-efficacy a significant predictor of exercise behavior across populations? |
| Marketing and consumer behavior | What is the effect size of advertising spend on brand recall? |
How to Conduct a Meta-Analysis: Step-by-Step
Conducting a meta-analysis is a multi-stage process that demands careful planning, rigorous execution, and transparent reporting. The steps below represent the accepted standard methodology.
Step 1: Define the Research Question
The entire meta-analysis is anchored by a precise, answerable research question. Broad or vague questions produce poorly targeted literature searches and heterogeneous study pools. The question should specify:
- The target population (e.g., adults with Type 2 diabetes)
- The exposure, intervention, or predictor of interest
- The comparator (e.g., placebo, usual care, no intervention)
- The outcome(s) to be measured
- The study designs to be considered
Before a literature search can begin, the research question must be translated into a structured framework that defines what to search for and what to include. Different frameworks suit different research contexts. PICO is the most familiar, but several alternatives exist for qualitative, health services, organisational, and social science research.
SPICE
Designed for evaluating service-based or qualitative research questions, particularly in library and information science, social care, and health services research.
| Element | Stands For | Example |
| S | Setting | Hospital outpatient clinics in low-income countries |
| P | Perspective | Adult patients with chronic illness |
| I | Intervention (or Interest) | Peer-support programmes |
| C | Comparison | Standard nurse-led follow-up |
| E | Evaluation | Patient self-management and quality of life |
Best suited for:
- Evaluating the quality or outcomes of a service or programme
- Questions where the setting and the perspective of the recipient are central to the research question
- Qualitative and mixed-methods systematic reviews
Key distinction from PICO:
SPICE foregrounds who experiences the service (Perspective) and where it takes place (Setting) as primary search dimensions, rather than treating these as background characteristics.
ECLIPSE
Developed specifically for health policy, management, and health services research questions, where the focus is on improving or changing a service rather than testing a clinical intervention.
| Element | Stands For | Example |
| E | Expectation | Reduce waiting times and improve patient flow |
| C | Client group | Adult emergency department attendees |
| L | Location | Urban NHS hospitals, England |
| I | Impact | Patient satisfaction; discharge within 4 hours |
| P | Professionals | Emergency nurses and triage staff |
| SE | Service | Emergency department triage and streaming service |
Best suited for:
- Health service improvement questions
- Policy evaluation and organisational change research
- Questions where multiple professional roles and institutional contexts are relevant
Key distinction from PICO and SPICE:
ECLIPSE explicitly separates the expected outcome (Expectation) from the measured impact and requires identification of the relevant professionals and the service being evaluated. These are dimensions absent from clinical frameworks.
PEO
A simplified three-element framework used primarily in qualitative research and epidemiological studies exploring experiences, attitudes, or exposures, where there is no intervention or comparator.
| Element | Stands For | Example |
| P | Population | Adolescent girls in sub-Saharan Africa |
| E | Exposure (or issue of interest) | Experience of early forced marriage |
| O | Outcome | Mental health and educational attainment |
Best suited for:
- Qualitative systematic reviews exploring lived experience
- Epidemiological reviews examining exposure-outcome associations without a comparison group
- Prevalence reviews (links directly to Single-Group/Single-Arm meta-analysis)
- Questions where imposing a comparator would be artificial or inappropriate
Key distinction:
PEO makes no assumption that an intervention exists or that a comparison group is available. It is the natural companion framework for single-group meta-analyses and prevalence syntheses.
CoCoPop
Developed for prevalence and incidence reviews, CoCoPop provides a structured alternative to PICO for single-group meta-analyses where the goal is to estimate how common something is.
| Element | Stands For | Example |
| Co | Condition | Post-traumatic stress disorder (PTSD) |
| Co | Context | Following natural disasters |
| Pop | Population | Adults aged 18 and over |
Best suited for:
- Prevalence and incidence meta-analyses (directly paired with single-group/single-arm meta-analysis)
- Epidemiological burden-of-disease reviews
- Reviews estimating diagnostic rates, complication frequencies, or mortality rates
Key features:
- Condition defines what is being measured (diagnosis, symptom, behaviour, event)
- Context specifies the circumstances, setting, or exposure in which the condition is measured
- Population defines who is being studied
Key distinction from PEO:
CoCoPop is narrower and more precise. It is designed specifically and exclusively for prevalence/incidence questions, whereas PEO accommodates a broader range of qualitative and observational research questions.
CIMO
Drawn from realist evaluation and implementation science, CIMO structures questions about how and why interventions work, not just whether they work. It is particularly suited to realist synthesis and theory-driven systematic reviews.
| Element | Stands For | Example |
| C | Context | Primary care settings in rural, resource-limited environments |
| I | Intervention | Community health worker home-visit programme |
| M | Mechanism | Increased social trust and access to information trigger behaviour change |
| O | Outcome | Improved uptake of childhood vaccination |
Best suited for:
- Realist synthesis and realist reviews
- Implementation science and knowledge translation research
- Complex interventions where outcomes depend heavily on context
- Management, organisational, and educational research
Key features:
- Mechanism is the defining element. It asks how and why the intervention produces its effect, not just what the effect is
- Context is treated as a causal variable, not merely background information
- Recognises that the same intervention may work in one context and fail in another
Key distinction from all other frameworks:
CIMO explicitly theorises the causal pathway between intervention and outcome. It is incompatible with standard aggregate data meta-analysis, which does not model mechanisms. It is instead the foundation for realist synthesis, a qualitative or mixed-methods approach to evidence synthesis.
Choosing the Right Framework
| Framework | Research Type | Comparator Needed? | Mechanism Modelled? | Paired Meta-Analysis Type |
| PICO | Clinical/intervention | Yes | No | Pairwise; network |
| SPICE | Service/qualitative | Optional | No | Qualitative synthesis; mixed methods |
| ECLIPSE | Health policy/management | No | No | Narrative or qualitative synthesis |
| PEO | Qualitative/observational | No | No | Single-group; qualitative synthesis |
| CoCoPop | Prevalence/incidence | No | No | Single-group (aggregate data) |
| CIMO | Realist/implementation | No | Yes | Realist synthesis |
Step 2: Register a Protocol
Before searching the literature, researchers should pre-register their protocol on a public repository such as PROSPERO (for health-related reviews) or the Open Science Framework. Pre-registration:
- Reduces the risk of outcome-reporting bias by committing to the analysis plan in advance.
- Enhances transparency and reproducibility.
- Allows other researchers to identify ongoing reviews and avoid duplication.
Step 3: Define Inclusion and Exclusion Criteria
Eligibility criteria determine which studies will enter the analysis. They should be defined before the literature search begins and documented clearly. Criteria typically cover:
- Study design: e.g., RCTs only, or observational studies included.
- Population: age range, diagnosis, occupational group, geographic region.
- Intervention/exposure: type, dose, duration, delivery mode.
- Comparator: placebo, no treatment, alternative intervention.
- Outcome: specific measurable outcomes and the instruments used to measure them.
- Language and publication date: whether non-English studies and grey literature are included.
Step 4: Conduct a Comprehensive Literature Search
The search must be exhaustive to minimize selection bias. A robust strategy includes:
- Searching multiple electronic databases (e.g., PubMed/MEDLINE, Embase, PsycINFO, Cochrane Library, Web of Science, Scopus).
- Using carefully constructed search strings with MeSH terms, Boolean operators (AND, OR), and synonyms.
- Searching grey literature (conference proceedings, government reports, dissertations) to reduce publication bias.
- Reviewing reference lists of included studies (backward citation searching).
- Forward citation searching: identifying newer studies that cite the included papers.
- Contacting subject-matter experts for unpublished data.
Step 5: Screen Studies for Inclusion
Screening occurs in two stages:
- Stage 1, Title and abstract screening: Rapidly excludes clearly irrelevant records.
- Stage 2, Full-text assessment: Applies the full eligibility criteria to remaining papers.
Both stages should be performed independently by at least two reviewers, with disagreements resolved by discussion or a third arbitrator. Software tools such as Covidence, Rayyan, or EPPI-Reviewer streamline this process. All exclusions at the full-text stage must be recorded with reasons, as required by the PRISMA flow diagram.
Step 6: Assess Study Quality and Risk of Bias
Not all studies are equally rigorous. Quality assessment determines how much confidence to place in each study’s results. Commonly used tools are listed below.
| Tool | Study Design | Key Domains Assessed |
| Cochrane Risk of Bias Tool (RoB 2) | Randomized controlled trials | Randomization, allocation concealment, blinding, outcome reporting |
| ROBINS-I | Non-randomized interventional studies | Confounding, selection bias, information bias, reporting bias |
| Newcastle-Ottawa Scale (NOS) | Cohort and case-control studies | Selection, comparability, outcome/exposure |
| Jadad Scale | Randomized controlled trials | Randomization, blinding, withdrawals |
| MINORS | Non-randomized surgical/clinical studies | Study design, reporting, statistical analysis |
| QUADAS-2 | Diagnostic accuracy studies | Patient selection, index test, reference standard, flow and timing |
Quality assessment findings may influence whether studies are included in the main analysis, assigned differential weights, or used only in sensitivity analyses.
Step 7: Extract Data
Data extraction involves systematically collecting information from each included study into a standardized form. At minimum, researchers extract:
- Study identifiers: author, year, country, journal.
- Study design characteristics: design type, sample size, follow-up duration.
- Population characteristics: age, sex, clinical or demographic features.
- Intervention or exposure details.
- Outcome data: means, standard deviations, event counts, sample sizes, and any reported effect sizes with confidence intervals or p-values.
- Methodological quality scores.
Two or more reviewers should extract data independently, with discrepancies resolved through discussion. When required data are missing from the publication, authors of the original study should be contacted. Imputation methods may be used when contact yields no response, but this must be reported transparently.
Step 8: Calculate Effect Sizes
The effect size is the fundamental unit of analysis in a meta-analysis. It translates the results of each study into a common metric that can be compared and combined across studies. The choice of effect size metric depends on the type of outcome data available.
| Metric | Data Type | Interpretation |
| Cohen’s d / Hedges’ g | Continuous outcomes (means) | Standardized mean difference; 0.2 = small, 0.5 = medium, 0.8 = large |
| Pearson’s r | Correlational outcomes | Correlation coefficient; 0.1 = small, 0.3 = medium, 0.5 = large |
| Odds Ratio (OR) | Binary outcomes | Ratio of odds of event; OR = 1 means no effect |
| Risk Ratio (RR) | Binary outcomes (common events) | Ratio of event probabilities; RR = 1 means no difference |
| Hazard Ratio (HR) | Time-to-event outcomes | Ratio of hazard rates over time |
| Risk Difference (RD) | Binary outcomes | Absolute difference in event rates between groups |
| Standardized Mean Change | Pre-post intervention designs | Change from baseline expressed in standard deviation units |
Each effect size is also associated with a measure of precision, usually its standard error or sampling variance. Studies with larger samples provide more precise (smaller variance) estimates and are weighted more heavily in the pooled analysis.
Step 9: Choose a Statistical Model
The two primary models for pooling effect sizes are:
Fixed-Effects Model
Assumes that all included studies are estimating the same underlying true effect size, and that observed differences between studies are due solely to sampling error. Under this assumption, the best estimate is obtained by weighting each study by the inverse of its sampling variance. The fixed-effects model is appropriate only when studies are very homogeneous in design, population, and intervention.
Random-Effects Model
Assumes that the true effect size is not identical across studies but varies according to a distribution. Each study is assumed to be estimating a slightly different true effect, and the pooled result represents the mean of that distribution. The random-effects model accounts for both within-study (sampling) variance and between-study (tau-squared, τ²) variance. It is the preferred model when studies differ in design or when heterogeneity is observed or anticipated.
| Feature | Fixed-Effects | Random-Effects |
| Assumption about true effect | One universal true effect | True effect varies across studies |
| Sources of variance modelled | Sampling error only | Sampling error + between-study variance |
| Weight formula | Inverse of within-study variance | Inverse of within-study + between-study variance |
| Confidence interval width | Narrower | Wider (more conservative) |
| Preferred when | Studies are very similar; minimal heterogeneity | Studies differ; heterogeneity is present or expected |
| Generalization | Only to studies like those included | To a wider, hypothetical population of studies |
Step 10: Assess Heterogeneity
Heterogeneity is the degree to which effect sizes vary across studies beyond what chance alone would predict. It must be assessed before interpreting the pooled result. The two key statistics are:
- Cochran’s Q: Tests whether the variation in effect sizes is greater than expected by chance. A significant Q (p < 0.10) indicates heterogeneity. However, Q has low power when there are few studies.
- I² statistic: Quantifies the proportion of total variance attributable to between-study differences, expressed as a percentage.
| I² Value | Interpretation | Recommended Action |
| 0–25% | Low heterogeneity | Fixed-effects model may be appropriate; proceed with pooling |
| 25–50% | Moderate heterogeneity | Investigate sources; random-effects model preferred |
| 50–75% | Substantial heterogeneity | Consider subgroup or sensitivity analyses; interpret pooled result cautiously |
| 75–100% | Considerable heterogeneity | Question the appropriateness of pooling; narrative synthesis may be preferable |
Step 11: Explore Sources of Heterogeneity
When heterogeneity is present, researchers investigate potential explanations using:
- Subgroup analysis: Divides studies into subgroups based on a characteristic (e.g., intervention type, age group, country, study design) and calculates a separate pooled effect for each subgroup. Differences between subgroup effects suggest that the characteristic is a moderator.
- Meta-regression: A regression model where study-level characteristics (moderator variables) are used as predictors of effect size. It is analogous to standard regression but operates at the study level rather than the participant level. Requires a minimum of approximately 10 studies per moderator tested to avoid overfitting.
Step 12: Assess Publication Bias
Publication bias is the phenomenon whereby studies with statistically significant or positive results are more likely to be published than those with null or negative results. This distorts the literature and can inflate the pooled effect size in a meta-analysis. Assessment methods include:
- Funnel plot: A scatter plot of effect size (x-axis) against study precision (y-axis, often standard error inverted). In the absence of publication bias, the plot should be symmetrical around the true effect. Asymmetry — particularly a missing cluster of small, negative studies in the lower-left — suggests potential bias.
- Egger’s regression test: A formal statistical test of funnel plot asymmetry; a significant result (p < 0.10) suggests publication bias.
- Begg’s rank correlation test: An alternative test using rank correlation between standardized effect sizes and their variances.
- Trim-and-fill method: A non-parametric method that estimates how many studies are “missing” due to publication bias, imputes them symmetrically, and recalculates an adjusted pooled estimate.
- Rosenthal’s Fail-safe N: Calculates how many null-result studies would need to exist in file drawers to reduce the overall effect to non-significance.
Step 13: Conduct Sensitivity Analyses
Sensitivity analyses test the robustness of the main results. Common approaches include:
- Excluding studies with high risk of bias and recalculating the pooled effect.
- Removing one study at a time (“leave-one-out” analysis) to check whether any single study drives the overall result.
- Switching between fixed-effects and random-effects models to compare estimates.
- Restricting the analysis to specific study designs, languages, or publication periods.
- Applying different imputation methods for missing data.
If the main findings are robust across sensitivity analyses, confidence in the conclusions increases substantially.
Step 14: Interpret and Report Results
Interpretation requires considering the pooled effect size in context:
- Statistical significance: Does the 95% confidence interval exclude the null value (0 for d/r; 1 for OR/RR)?
- Practical/clinical significance: Is the effect large enough to matter in the real world, regardless of statistical significance?
- Direction of effect: Is the effect in the hypothesized direction?
- Consistency: Are most studies pointing in the same direction? A small pooled effect driven by some large positive studies and some negative studies carries a different meaning from one where all studies show a small positive effect.
- Limitations: What are the methodological limitations of the included studies, the review process itself, and the generalizability of the findings?
Forest Plots: Reading the Signature Output of Meta-Analysis
The forest plot is the graphical signature of a meta-analysis. It displays the results of each individual included study alongside the pooled summary estimate. Key components of a forest plot include:
- Study labels: listed on the left, identifying each included study (usually author and year).
- Effect size point estimates: shown as a square or dot for each study; the size of the square is proportional to the study’s weight in the analysis.
- Confidence intervals: shown as horizontal lines extending from each square; wider lines indicate less precise estimates.
- Vertical line of no effect: at 0 for continuous outcomes (d, g) or at 1 for ratio outcomes (OR, RR). Studies whose confidence intervals cross this line are not statistically significant on their own.
- Summary diamond: at the bottom, representing the pooled effect size; its width represents the 95% confidence interval of the pooled estimate.
- Heterogeneity statistics: Q, p-value, and I² are typically reported below the plot.
When reading a forest plot, the key observations are whether the diamond (pooled estimate) crosses the line of no effect, how tightly clustered the individual studies are around the pooled estimate (indicating homogeneity), and whether any outlier studies are apparent.
Sample Forest Plot: Nursing-Led Mindfulness Interventions for Anxiety
In this scenario, we are looking at a fictitious meta-analysis of Nursing-Led Mindfulness Interventions vs. Standard Care for Reducing Post-Operative Anxiety. The outcome is measured using a continuous scale (e.g., Hamilton Anxiety Rating Scale), so we use Hedges’ g as our effect size. Therefore, our line of no effect is at 0.
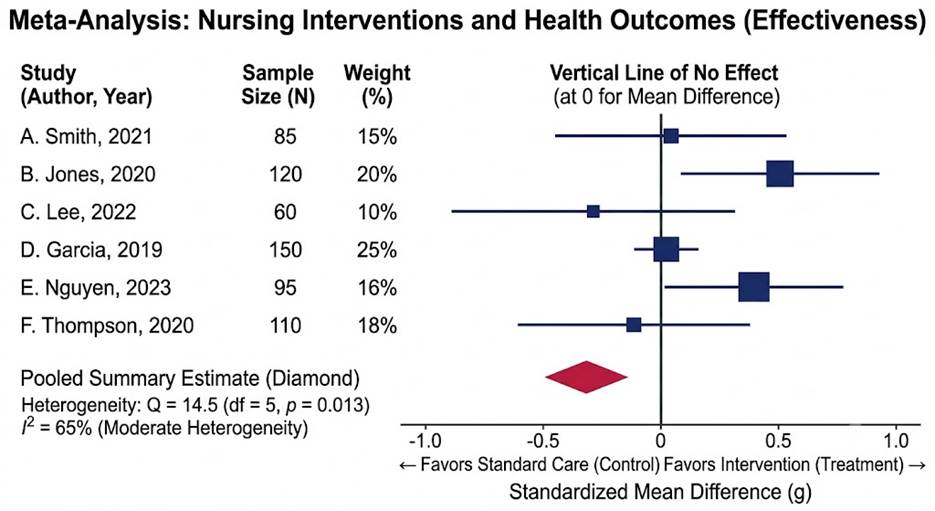
What the pooled result shows:
- The summary diamond sits to the left of the vertical line of no effect (0), indicating the pooled effect favours standard care (control) over the nursing intervention overall.
- The diamond does not cross the zero line, suggesting the pooled result is statistically significant.
Individual study findings:
- B. Jones (2020) and E. Nguyen (2023) both show point estimates well to the right, favouring the intervention — and are among the heavier-weighted studies (20% and 16%).
- C. Lee (2022) and F. Thompson (2020) show point estimates clearly to the left, favouring standard care.
- A. Smith (2021) and D. Garcia (2019) sit close to the zero line, suggesting little difference between conditions in those studies.
- Wide confidence intervals (e.g., A. Smith, C. Lee) indicate low precision, consistent with their smaller sample sizes (85 and 60).
Heterogeneity:
- Q = 14.5, p = 0.013. There is statistically significant heterogeneity; the studies are not estimating the same underlying effect.
- I² = 65% This result is classified as substantial heterogeneity, meaning 65% of the variance in effect sizes reflects genuine between-study differences, not sampling error alone.
- This level of heterogeneity means the pooled estimate should be interpreted cautiously; subgroup analyses or meta-regression would be warranted to explore why results differ so markedly across studies.
Advantages and Limitations of Meta-Analysis
Advantages
- Increased statistical power: By combining sample sizes from many studies, meta-analysis provides far greater power to detect small but true effects that individual studies might miss due to inadequate sample sizes.
- More precise effect size estimates: The pooled estimate is generally more accurate and carries narrower confidence intervals than any single primary study.
- Resolution of conflicting findings: Meta-analysis can reconcile apparently contradictory results across studies by identifying moderator variables that explain why one study found an effect and another did not.
- Avoidance of duplicate research: By synthesizing existing evidence, meta-analysis helps identify where knowledge is already sufficient and where primary research is still needed, preventing wasteful duplication.
- Transparency and reproducibility: The systematic, documented process allows independent researchers to evaluate and replicate the methodology.
- Time and resource efficiency: For decision-makers, a single high-quality meta-analysis can substitute for reviewing hundreds of individual studies.
- Identification of moderators: Subgroup analyses and meta-regression reveal which participant characteristics, settings, or intervention features are associated with larger or smaller effects.
Limitations and Criticisms
- “Garbage in, garbage out”: The quality of a meta-analysis is bounded by the quality of the included studies. Including poorly designed or biased primary studies will produce a biased pooled result, regardless of the statistical sophistication applied.
- The apples-and-oranges problem: Combining studies that are too different in design, population, intervention, or outcome measures may produce a meaningless average, even if statistical tests suggest acceptable heterogeneity.
- Publication bias: The tendency for positive results to be published more than null results means that a meta-analysis based only on published literature may overestimate the true effect size.
- Context stripping: Aggregating across studies can obscure important contextual factors that determined outcomes in individual studies.
- Resource intensity: A rigorous meta-analysis is time-consuming and typically requires a multidisciplinary team of researchers, statisticians, and subject-matter experts.
- Sensitivity to decision points: Choices about which studies to include, which statistical model to use, and how to handle missing data can all influence the final result, introducing researcher degrees of freedom.
- Cannot resolve poor primary research: If the underlying evidence base is sparse or of uniformly low quality, no statistical technique can compensate.
| Advantages | Limitations |
| Increases statistical power | Quality bounded by primary studies |
| Provides more precise effect size | Publication bias can inflate estimates |
| Resolves conflicting findings | Heterogeneous studies may not be combinable |
| Saves decision-maker time | Resource-intensive to conduct rigorously |
| Identifies moderator variables | Context of individual studies may be lost |
| Transparent and reproducible | Sensitive to methodological decision points |
| Guides future research priorities | Cannot correct for poor underlying evidence |
Reporting Standards: PRISMA and Transparent Practice
Transparent reporting is essential if a meta-analysis is to be appraised, replicated, and applied with confidence. The PRISMA (Preferred Reporting Items for Systematic Reviews and Meta-Analyses) statement is the internationally recognized standard for reporting. Originally published in 2009 and updated to PRISMA 2020, it consists of a 27-item checklist and a flow diagram.
PRISMA Flow Diagram
The PRISMA flow diagram traces the trajectory of studies from initial identification through to final inclusion, documenting:
- Number of records identified from each database and other sources.
- Number of records removed for duplication.
- Number of records screened at title/abstract stage and the number excluded.
- Number of full-text articles assessed for eligibility and the number excluded (with reasons).
- Number of studies included in the final analysis.
Key PRISMA Checklist Domains
- Title and abstract: identify the report as a systematic review or meta-analysis.
- Introduction: rationale and explicit statement of objectives.
- Methods: eligibility criteria, information sources, search strategy, selection process, data extraction process, risk of bias assessment, synthesis methods.
- Results: study selection, characteristics, risk of bias summary, synthesis results including pooled effect sizes and heterogeneity statistics.
- Discussion: interpretation, limitations, conclusions.
- Other: registration details, competing interests, data availability.
Related Reporting Guidelines
- MOOSE (Meta-analysis of Observational Studies in Epidemiology): for meta-analyses based on observational studies.
- QUOROM: precursor to PRISMA, now largely replaced.
- GRADE (Grading of Recommendations, Assessment, Development, and Evaluations): a framework for rating the overall certainty of evidence synthesized in a review, from very low to high.
What Software Tools can be used for Meta-Analysis?
A range of specialized statistical software packages are available to conduct meta-analyses. The choice of software depends on the researcher’s statistical background, the type of analysis required, and budget constraints.
| Software | Key Features | Cost/Access |
| R (metafor, meta packages) | Highly flexible; full range of models including random-effects, meta-regression, publication bias tests; produces publication-quality forest plots | Free (open-source) |
| RevMan (Cochrane) | Designed specifically for Cochrane systematic reviews; user-friendly interface; integrates risk of bias assessment | Free |
| Comprehensive Meta-Analysis (CMA) | Point-and-click interface; broad range of effect size calculations; used widely in psychology and medicine | Commercial licence |
| Stata (metan, metareg) | Powerful command-line interface; extensive meta-analysis add-on packages; preferred in epidemiology | Commercial licence |
| MetaXL | Excel-based; includes Quality Effects model and IVhet model as alternatives to random-effects | Free |
| SPSS (with macros) | Familiar to social science researchers; meta-analysis macros available | Commercial licence |
| OpenMeta[Analyst] | Open-source; graphical interface; supports network meta-analysis | Free |
Applications of Meta-Analysis Across Disciplines
Meta-analysis is not confined to medicine or clinical research. Its principles apply wherever quantitative empirical studies accumulate on a shared question.
Healthcare and Medicine
This is the original and most established domain for meta-analysis. Applications include:
- Evaluating the efficacy and safety of new drugs or medical devices in randomised trials.
- Comparing surgical techniques or treatment protocols.
- Identifying risk factors for chronic diseases (e.g., the association between diet and cardiovascular events).
- Informing clinical practice guidelines (e.g., NICE guidelines in the UK, US Preventive Services Task Force recommendations).
- Estimating population prevalence of diagnoses or symptoms.
Psychology and Social Sciences
Meta-analysis transformed psychology by making it possible to quantify effects that had been debated qualitatively for decades. Applications include:
- Measuring the effectiveness of psychotherapy, cognitive training, or behavioural interventions.
- Estimating relationships between psychological constructs (e.g., self-esteem and academic achievement).
- Examining group differences in cognitive abilities, personality traits, or attitudes.
- Studying the effect of parenting styles on child developmental outcomes.
Education
In education research, meta-analysis is used to evaluate:
- The relative effectiveness of different teaching methods, curricula, or educational technologies.
- The impact of class size, teacher training, or homework on academic outcomes.
- Factors associated with student engagement or dropout rates.
Economics and Public Policy
- Estimating the effect of minimum wage policies on employment.
- Quantifying the return on investment of training programs.
- Synthesizing evidence on the economic impact of environmental regulations.
Marketing and Consumer Research
Meta-analysis in marketing allows firms and researchers to draw aggregate conclusions across fragmented empirical evidence. Applications include:
- Estimating the overall effect of advertising spend on brand awareness or sales.
- Synthesizing findings on the relationship between customer satisfaction and loyalty.
- Quantifying the effect of online reviews or social proof on purchase intention.
- Comparing the effectiveness of different pricing strategies across product categories.
Frequently Asked Questions
The following questions reflect common points of confusion among students, practitioners, and researchers encountering meta-analysis for the first time.
How many studies do you need to conduct a meta-analysis?
There is no universally agreed minimum, but the practical and statistical consensus is that a meta-analysis on fewer than three to five studies is likely to be of limited value. Most methodologists recommend at least five to ten studies for a meaningful pooled estimate, and more are needed for reliable meta-regression (approximately ten studies per moderator variable). With very few studies, the confidence interval around the pooled estimate is often too wide to be informative, and heterogeneity statistics lose power.
Can I conduct a meta-analysis on qualitative studies?
Standard meta-analysis requires quantitative data, specifically numerical effect sizes and measures of their precision. For qualitative studies, the analogous synthesis method is called meta-ethnography or qualitative evidence synthesis (QES), which integrates themes and interpretations rather than statistics. Some hybrid methods (e.g., mixed-methods systematic review) exist for combining qualitative and quantitative evidence, but they do not produce a pooled statistical effect size.
What is the difference between a pooled effect size and a simple average of effect sizes?
A simple (unweighted) average treats every study equally regardless of its sample size or precision. A pooled effect size weights each study by the inverse of its variance, meaning studies with larger samples and smaller standard errors contribute more to the overall estimate. This weighting gives more influence to the studies that provide the most reliable information, producing a more accurate summary.
Is a meta-analysis always better evidence than a single large RCT?
Not necessarily. A single large, rigorously designed RCT with an adequate sample size, blinded outcome assessment, and low risk of bias can sometimes provide stronger evidence on a specific question than a meta-analysis pooling many small, methodologically variable studies. The quality of the input studies and the appropriateness of pooling are the determining factors. A meta-analysis of poor-quality studies is inferior to a single high-quality trial.
What does it mean if the I² value is high but the pooled result is still statistically significant?
A high I² (e.g., above 75%) combined with statistical significance means that although most studies point in the same direction and the pooled result is formally significant, there is substantial variability in the size of the effect across studies. In practical terms, this tells us that the intervention probably works, but how well it works depends heavily on context, population, setting, or study design. Subgroup analyses and meta-regression should be conducted to explore what drives this variability before applying the results.
Do you need to be a statistician to conduct a meta-analysis?
Not necessarily, but a solid grounding in basic statistics is essential. Researchers need to understand effect size metrics, confidence intervals, weighting, and the assumptions of the statistical models used. User-friendly software such as RevMan (for Cochrane reviews) or CMA (Comprehensive Meta-Analysis) makes the mechanics accessible without requiring advanced programming skills. However, for complex analyses such as meta-regression, network meta-analysis, or individual patient data meta-analysis, collaboration with a biostatistician is strongly recommended.
What is the difference between a prospective and a retrospective meta-analysis?
In a retrospective meta-analysis (the most common type), the analysis is conducted on studies that have already been published or completed. In a prospective meta-analysis (PMA), the protocol for the meta-analysis is developed before the primary studies are completed, and individual studies are designed to collect compatible data. PMAs allow for more consistent outcome measurement, reduce outcome-reporting bias, and enable individual patient data pooling. They are increasingly used in clinical trials research to enable efficient evidence generation.
Can a meta-analysis prove causation?
Meta-analysis can demonstrate strong statistical associations and, when based on RCTs, can strengthen causal inferences significantly. However, it cannot establish causation on its own. The causal interpretation depends on the design of the underlying studies (observational studies cannot prove causation even when pooled), the plausibility of the mechanism, the consistency and specificity of the findings, and consideration of confounding factors. Even a meta-analysis of RCTs requires careful attention to internal validity, allocation concealment, and blinding.
How long does it take to conduct a meta-analysis?
A comprehensive, rigorous meta-analysis typically takes between six months and two years, depending on the breadth of the literature search, the number of studies identified, the complexity of the analysis, and the size of the research team. The most time-consuming stages are usually the literature search and screening (which may involve reviewing thousands of titles and abstracts) and the data extraction process (which must be done independently by at least two researchers and checked for agreement). Smaller-scale or focused meta-analyses on well-defined topics with a compact literature can sometimes be completed in three to six months.


Comment