A complete guide to graphical abstract templates and their types

Key takeaway: Graphical abstract templates can be single panel, multipanel, or circular, and the best free sources of these templates are tools like Mind the Graph and Canva.
What is a graphical abstract?
A graphical abstract is an easy-to-grasp visual summarization of a study. These visual summaries are now quite common in academic publications, serving as the first point of engagement with a reader. As a result, it is becoming increasingly important for authors to be able to conceive and create striking graphical abstracts. Just like in the popular game Pictionary, creating a graphical abstract requires choosing the most instantly recognizable visual elements. A simple drawing (say, a cloud with lines for “rain”) might not be enough—adding context (like an umbrella) could be crucial for clearer understanding. The challenge lies in selecting visuals that effectively communicate your message at the first glance.
Next, to guide the effective presentation of the data and to keep with the prevalent style of the target journal, graphical abstract templates are important. Custom templates might be provided by the publisher or by specialized tools. An author can even create templates from scratch using tools such as PowerPoint, Canva, or Adobe Illustrator.
Graphical abstract template types
Various visual abstract templates cater to different data types and research or presentation needs. Important considerations are size, design, and color palette. Some common formats are as follows:
Single panel:
Information may from left to right or top to bottom. This format is ideal for straightforward studies with a clear message.
Left-to-right:
Text is arranged with left-to-right formatting and may be used to describe a sequence of events or depict a series of scientific conclusions.
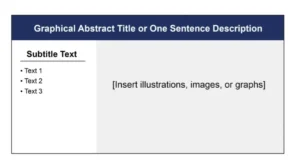 Figure 1: Left to right graphical abstract template example (Source: Simplified Science Publishing)
Top-to-bottom:
Text moves naturally go from top to bottom, which suits data moving from, say, a large to small quantity, north to south on a map, or from topsoil to lower soil layers.
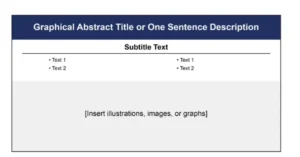
Figure 2: Top to bottom graphical abstract template example (Source: Simplified Science Publishing)
Two or more panels:
The use of multiple panels in a visual abstract template can help illustrate processes or depict comparisons. One unique variant of a multi-panel format is a “comic strip” graphical abstract.
Circular
Such a format might be effective for depicting cyclical processes or details warranting pie charts or nested pie charts.
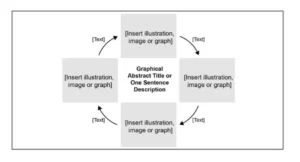
Figure 3: Circular graphical abstract template example (Source: Simplified Science Publishing)
Timelines
These are effective when showing sequences or timelines, highlighting important events or milestones. Information may flow in a left-to-right or top-to-bottom manner.
Note that these templates can be customized using software such as PowerPoint or Adobe Illustrator, or specialized tools such as Mind the Graph.
Where can I find free graphical abstract templates?
Mind the Graph
This is a user-friendly platform that allows researchers to create graphical abstracts quickly. With access to hundreds of customizable templates relevant to over 80 scientific fields, you can select a template, customize elements, and download the final graphic in different formats as per your journal’s requirement. The best part is that extensive graphic design experience is not needed!
Canva
Canva is a more generalized tool, but it can be customized for researcher use as well. For this, you need to select “Education” as a category and “Graphic Organizers” under “Resource Type”.
You can start with a blank canvas and use the drag-and-drop interface, or you could choose from pre-designed layouts.
Journal-specific templates
Journals or journal publishers might provide custom templates and examples that authors can follow. A journal might specify the number of permissible panels, a journal-specific color scheme, and so on.
And finally, where no specifics are provided, you can let your creative juices flow and produce unusual and catchy visuals. Let’s say you want a younger readership to engage with your research; why not consider using pop culture references? See this one with Drake and Pokémon references!
Conclusion
Graphical abstracts are an essential component of modern scientific communication, enhancing the clarity and reach of research findings. Mastering the art of graphical abstracts will help you enhance your ability to communicate your findings effectively across various platforms. And voila, making these visual summaries is easy-peasy using graphical abstract templates!
Graphical Abstract Layout and Format FAQs
1. What are the different types of abstract formats?
Abstracts can be mainly categorized into two types: text and graphical abstracts. Text abstracts are the ones that are included at the beginning of all research papers. They can be structured or unstructured, depending on the field of study and journal requirements. Graphical abstracts are a means of communicating your research visually. Graphical abstracts predominantly use icons, graphics, and images while keeping the textual content minimal.
2. What should be included in a graphical abstract?
Typically, a graphical abstract should convey the core idea of the study in a schematic format or a simple directional layout. The 3 main components of a graphical abstract are as follows:
1) A brief background or the main methodology to establish context.
2) The key findings or results to highlight the outcome of the study.
3) A clear take-home message for the readers to grasp the essence of the study.
3. What are the 4 C’s of an abstract?
The 4 C’s of an abstract are Complete, Clear, Concise, and Cohesive. When preparing any abstract, graphical or text, focusing on these 4 C’s ensures that your work is summarized well for a wide audience.
- Complete: An abstract should cover all major parts of the research, including the methods, key results, and study implications.
- Clear: Abstracts should be well-organized and follow a directional flow to give a proper picture of the entire research.
- Concise: Abstracts must be kept brief and to the point. For instance, most text abstracts are within 150 to 250 words. On the other hand, graphical abstracts must include only the necessary icons and graphics with minimal text.
- Cohesive: Abstracts should flow smoothly from one point to the next without any disconnected ideas.
4. What is the best tool to make a graphical abstract?
Tools like Mind the Graph, Canva, Adobe Illustrator, Inkscape are commonly used by researchers to make graphical abstracts. With more than 75,000 scientifically accurate graphics from over 80 fields, Mind the Graph can help you create graphical abstracts from scratch using templates of your choice. If you are not comfortable using tools, you may opt for professional graphical abstract creation services as well.
Looking to make your research more impactful? Check out Editage’s Graphical Abstract Design Services and get professional support to make your research stand out.