Complete Guide on How to Create a Graphical Abstract for Research Papers

Why Creating Graphical Abstract is Important?
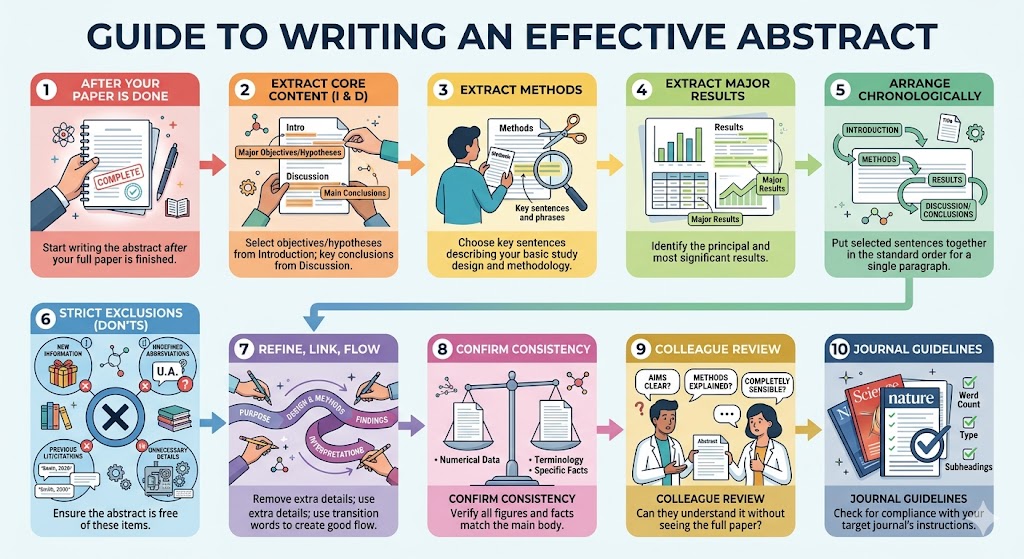
How to Make a Graphical Abstract for a Research Paper
Common Mistakes to Avoid When Creating a Graphical Abstract
How To Design Graphical Abstract FAQs
What is a Graphical Abstract?
A graphical abstract is a visual depiction of your research, typically serving as a supplement to your lengthy research paper. Using visual cues like icons, illustrations, graphics, pictograms, arrows, and other symbols helps convey the message of your research effectively and efficiently in today’s digital landscape.
Why Creating Graphical Abstract is Important?
Research is constantly in competition: every scientist hopes to stand out from the crowd and get noticed. Visuals are one way of making an impression in today’s fast-paced digital environment. The right visual tools can attract people toward your research paper and interest them in your findings. Visuals also serve other purposes; they
- Improve understanding
- Increase retention
- Save readers’ time
That’s why journals often mandate a graphical abstract. The purpose is two-fold: boost the impact of the scientists’ research and boost views, clicks, and ultimately citations for the journal. But it’s not easy to make a good graphical abstract. This blog provides you with simple tips for creating a graphical abstract.
How to Make a Graphical Abstract for a Research Paper
There are many tools like that can help you design a graphical abstract. While Mind the Graph and BioRender are known for their excellent choices of scientifically accurate illustrations, tools like Adobe Illustrator, Inkscape, and Canva are general designing aids that can simplify the process of creating a graphical abstract.
But how do you approach the designing effectively to make an eye-catching visual abstract for publication? Below are nine key factors to consider.
1. Identify the Main Message
The graphical abstract mut rouse the curiosity of readers sufficiently to make them want to read your research paper! But that does not mean that your graphical abstract should be incomplete. It must stand alone, independent of the research paper, and summarize the key findings and study implication completely without leaving the readers half-informed.
So, before you begin sketching, think of what your research is trying to convey. The main message or the take-home message should ideally be what you want your readers to retain after they have viewed your graphical abstract.
For instance, what was one significant finding that stood out from the rest? What unique approach helped you prove your hypothesis? Identify that one feature that’s worth highlighting in your visual abstract.
2. Choose Visuals Representing the Problem/Conclusion
Your choice of visuals should match your research. Take a look at this example graphical abstract. The illustrations highlight the problems faced when a person tries to reduce screen time. The impact over time is represented through suitable emotions being expressed.
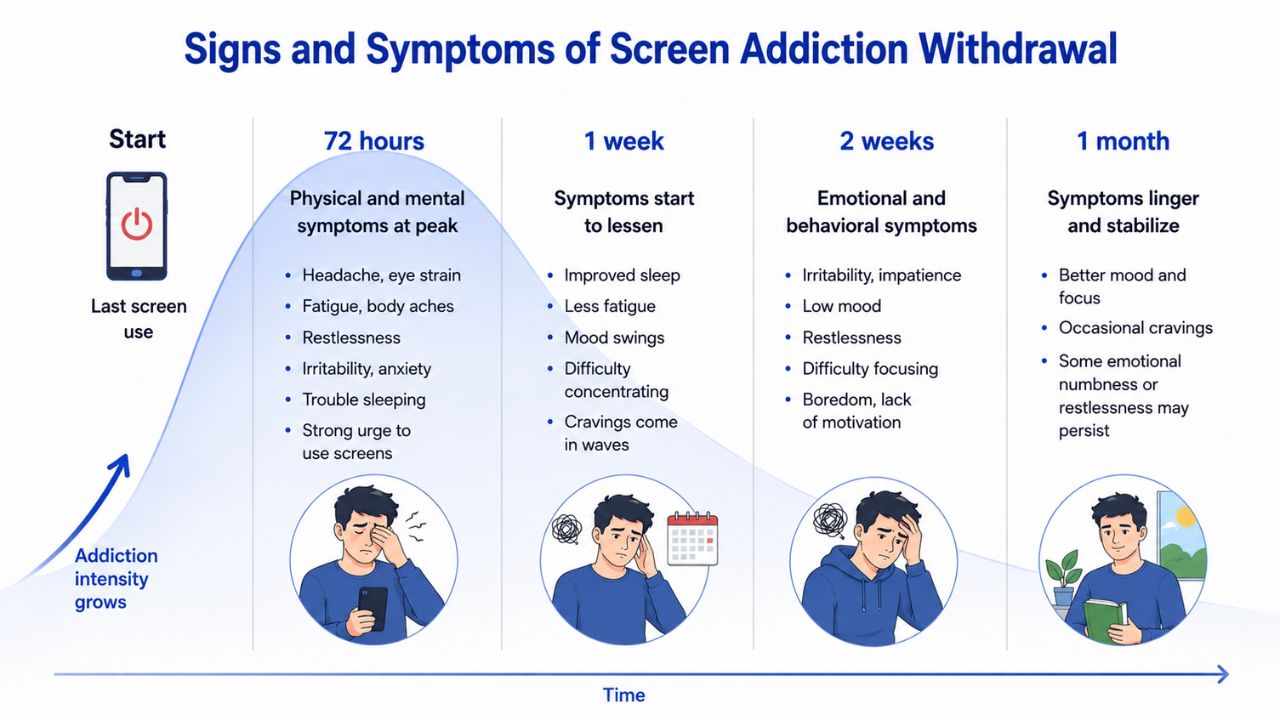
Likewise, your graphical abstract must use specific icons and illustrations depending on the research topic and the subject area.
3. Maintain Visual Hierarchy
Graphical abstracts can flow either from top to bottom or from left to right (like in the above example visual abstract). It can also be circular or a rectangular flowchart type depiction, especially if your study needs to represent a cyclical process.
Regardless, maintain a good visual hierarchy in your images. Remain consistent in what’s represented in the graphical abstract to ensure continuity of the visual story. For example, in the above image, it would look odd if the icon for the human representation had altered between male and female in each panel, wouldn’t it?
4. Avoid Excessive Data
Graphical abstracts are meant to capture the reader’s attention primarily through visuals. So, cluttering it with excessive text or numerical data will not serve the purpose. Some amount of textual information should be provided without overwhelming the reader. If representing numerical data is key to understanding the message you’re trying to convey, use them marginally.
Want to look at more examples? We share some ideas to help you create a visual abstract here.
5. Add Short Labels Where Needed
Your icons and illustrations, however specific, must be clearly labeled wherever necessary. Use short headings and brief points to draw the attention of readers to certain crucial aspects in the graphical abstract.
6. Choose the Right Colors and Fonts
The color palette in graphical abstracts must be easy on the eyes; not too jarring, not too pale. Just right to be able to create distinction between significant changes, if needed, without overpowering the intended visual impact.
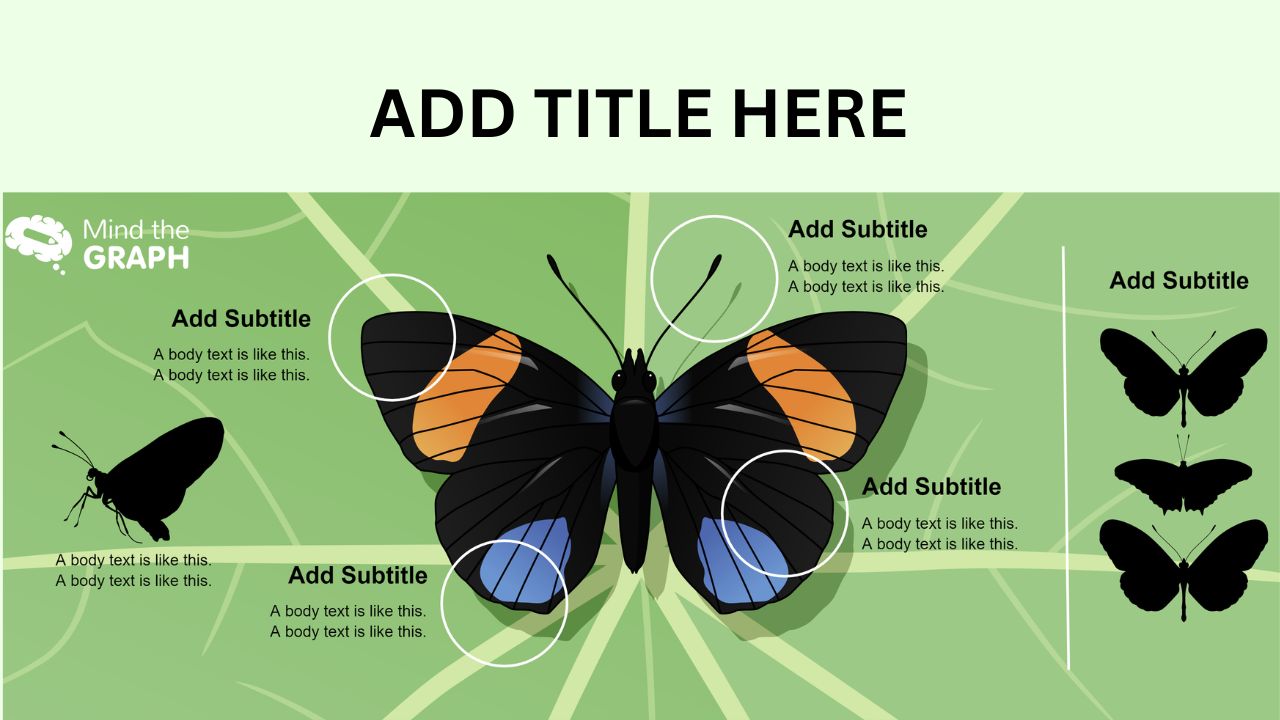
Sample graphical abstract template 1
Sample graphical abstract template 2
Here’s an example comparing a sample visual template with differing color palettes. While the first one helps notice the important features easily, the second one appears slightly unpleasant and the font color clashes with the dark background. Same figure, different representations. I will let you decide which one looks better! For further tips on layout, colors, and more, read this blog.
7. Use High-Quality Icons and Images
Graphical abstracts are likely to be shared and reshared online on multiple platforms. In whatever format you wish to upload, share, and publish it, clarity of the image becomes key. The icons and illustrations used within the graphical abstract must be of high quality. Even if the dimensions of the visual abstract are modified to make them suitable for various social media platforms, it should not compromise the quality of the image.
8. Keep Figures Easy to Read
Information retention happens better with visuals. But only if the figures are easy to read! Follow specific templates and layouts that are simple to understand at a glance.
9. Review for Accuracy and Clarity
When you are trying to tell the story of your entire research through a single image, accuracy is of utmost importance. Always review your final visual abstract by considering the following points:
- Does the title of the graphical abstract align with the research’s main message?
- Are the icons labeled correctly, where needed?
- Does the text match the illustrations depicted?
- Is the visual flow easy to grasp and can readers navigate the image seamlessly?
- Are the numerical data and textual information accurate?
- Is the quality of graphics, icons, and illustrations in line with journal’s requirements?
Common Mistakes to Avoid When Creating a Graphical Abstract
Adding Too Much Text
- Majority of your communication must happen through visuals in a graphical abstract. Text must be used minimally, such as short labels, headings, key findings etc.
- Adding lengthy descriptions or full sentences instead of brief points turns a graphical abstract into an infographic, defeating the purpose of a visual abstract.
Using Low Quality Images
- Poor quality images could fail to convey the research’s message. It also appears unprofessional when you submit low quality graphical abstracts to journals.
- Check the pixels and resolution recommended by the journal and follow the same. If specific dimensions are mentioned, choose a template accordingly.
Inconsistent Design Elements
- Check whether the icons, symbols, pictograms, graphics, and illustrations are from the same image library.
- Avoid picking up random design elements available online and including them in your graphical abstract.
Ignoring Journal Guidelines
- Journal-specified guidelines overrule all other designing and formatting requirements when preparing a graphical abstract.
- Confirm whether the format, recommended font for text, image size, and file type all match the journal requirements.
Overcomplicating the Workflow
- The image should follow a straightforward layout or template, simplifying the logical flow of visual information. Readers must be able to grasp the information quickly.
- Avoid over-cluttering the visual abstract with too many design elements. Be minimalistic. Present only essential details of the research rather than touching upon every minute aspect of the study.
How To Design Graphical Abstract FAQs
1. What exactly is a graphical abstract and how is it different from a regular abstract?
A graphical abstract is a pictorial representation of your research paper, highlighting the key message of your study through visual components. It is a means of communicating to the readers what your research is about by using minimal text and data.
Graphical abstract is an excellent way to promote your research paper on social media platforms. Unlike a regular textual abstract, visual abstracts help capture a reader’s attention quickly when they are browsing. A regular abstract is a block of text, which is less likely to appear interesting compared to a visually appealing image that still manages to convey the same message as a textual abstract.
2. How do I create a graphical abstract for my journal article?
Creating a graphical abstract requires proper planning. You can start with a rough sketch to decide the layout, flow, and distribution of visual and textual elements in your graphical abstract. Then, you may use designing tools to make a graphical abstract or opt for professional graphical abstract creation services.
If you are preparing a graphical abstract on your own, make use of proper templates, formats, layouts, and designing elements. Use appropriate designing tools like Mind the Graph or BioRender that are suitable for academic designing. Follow the journal guidelines regarding the file type, image dimensions, and any other requirements.
When using external services, you need to share the research manuscript (or perhaps the abstract) and target journal details with any other additional instruction you wish to share. Designers with expertise in your subject area and familiar with academic journals’ requirements will work on an initial draft, which, once approved by you, will be finalized and turned into a visually appealing graphical abstract.
3. Are graphical abstracts mandatory for journal submissions?
This depends on the target journal. If a graphical abstract is a mandate, this will be mentioned in the Instructions for Authors or Author Guidelines section on the journal website. Some journals do not require a graphical abstract in the initial submission but ask for one after the paper is accepted for publication. Other journals only “recommend” graphical abstracts as a good-to-have addition to your submission package, in which case you may or may not choose to supply one.
Our recommendation? Prepare a graphical abstract, nevertheless. Even if your journal does not mandate it, you can use it for research promotion post publication.
4. Are there any graphical abstract service providers online?
Yes! There are several graphical abstract service providers available online. Among them, Editage’s graphical abstract creation services aims to give you a professionally designed, high-quality, scientifically accurate visual abstract that is not only crafted for journal submissions but is also suitable for sharing online.
You can choose either a 2D or 3D graphical abstract design that best matches your needs. Simply share your research manuscript with us, fill out a questionnaire that captures your customized requirements, review the first draft shared by our design experts, and continue receiving support until you are satisfied with the final outcome.
5. Does having a graphical abstract increase the visibility of my research?
Graphical abstracts are highly suited for research promotion. They provide increased visibility for your work because of their conciseness, clarity, cohesive representation, and visual appeal. Graphical abstracts serve as excellent tools for promoting your published research paper on social media platforms to make the scientific community aware of your contributions.