How to Design a Graphical Abstract: Colors, Layout, Font, Accessibility, and Tools

Contents
- Key Takeaways
- Glossary of Key Terms
- Introduction
- What Is a Graphical Abstract?
- Core Design Principles
- Tools for Creating Graphical Abstracts
- Copyright and Image Attribution
- Getting Feedback Before You Submit
- Pre-Submission Checklist
- Frequently Asked Questions
- Further Resources
Key Takeaways
- A graphical abstract is a single-image visual summary of your research, increasingly required by major journals such as those published by Elsevier and Cell Press.
- Design around one to three key messages, not your entire study.
- Choose a consistent color palette of two to four colors and ensure sufficient contrast for color-blind readers.
- Use sans-serif fonts (Arial, Aptos, Helvetica) at a size that remains legible on a mobile screen without zooming.
- Design for the postage-stamp view first: if it looks interesting at thumbnail size, readers will click to enlarge.
- Check your target journal’s technical specifications for pixel dimensions, DPI, and accepted file formats before you start designing.
- Tools range from PowerPoint (free, familiar) to BioRender (biology-specific icons) to Adobe Illustrator (professional-grade); choose based on your field and skill level.
- General-purpose AI image generators (such as DALL-E) are currently prohibited for graphical abstracts by major publishers including Elsevier; always check your journal’s AI policy.
- Provide alt-text for your graphical abstract to improve accessibility and support readers with visual impairments.
Glossary of Key Terms
| Term | Definition |
| Graphical abstract | A single-panel visual that summarizes the key message, study design, and main findings of a research article in image form. |
| Visual abstract | Synonym for graphical abstract, used interchangeably by most publishers. |
| DPI (dots per inch) | A measure of image resolution. Most journals require a minimum of 300 DPI for photographs; 600 DPI or higher for line art and text-heavy figures. |
| Alt-text | A short written description of an image, embedded in digital files, that allows screen readers to convey the image content to visually impaired readers. |
| Sans-serif font | A typeface without small decorative strokes at the ends of characters. Examples: Arial, Helvetica, Aptos. Preferred for on-screen readability. |
| Serif font | A typeface with decorative strokes at character ends. Examples: Times New Roman, Georgia. Less readable at small sizes on screens. |
| Color palette | A defined set of two to four colors used consistently throughout a design. |
| WCAG | Web Content Accessibility Guidelines. An international standard for digital accessibility, including recommendations for color contrast ratios. |
| BioRender | A web-based scientific illustration tool with a library of over 50,000 scientifically accurate icons and templates, designed specifically for researchers. |
| TIFF | Tagged Image File Format. A lossless image format widely required by journals for final figure submission. |
| EPS | Encapsulated PostScript. A vector image format that scales without quality loss; accepted by most major publishers. |
| RGB / CMYK | RGB (Red, Green, Blue) is the color model for screens; CMYK (Cyan, Magenta, Yellow, Black) is used in print. Most journals accept RGB submissions and handle CMYK conversion. |
| Take-home point | The single most important conclusion or message a reader should retain after viewing or reading a piece of research communication. |
| Thumbnail view | The small, postage-stamp-sized version in which graphical abstracts first appear in journal table-of-contents listings and search results. |
Introduction
Designing a compelling graphical abstract is now an essential skill for researchers. Many leading journals, including those published by Elsevier, Cell Press, Springer Nature, and Wiley, either require a graphical abstract or strongly encourage one. A well-designed graphical abstract can:
- Increase a paper’s click-through rate in search results and journal table-of-contents listings
- Improve comprehension and information retention among readers, particularly those outside the author’s immediate discipline
- Extend the life of a paper on social media platforms where visual content performs better than text
- Help readers with limited time quickly decide whether to read the full article
Despite these benefits, most researchers receive no formal training in visual communication or graphic design. This guide addresses that gap, covering every aspect of graphical abstract design from initial concept through to technical submission requirements.
What Is a Graphical Abstract?
A graphical abstract is a single visual panel that summarizes a research article’s key message, study design, and main findings. It is not an infographic of the entire paper, and it is not a decorative image. It is a purposeful, structured communication tool.
A well-constructed graphical abstract has three parts:
- A start: the research question or problem being addressed
- A middle: how the question was approached, and what the key finding was
- An end: the conclusion or real-world implications of the findings
Graphical abstracts are typically displayed at thumbnail size (roughly 200 pixels high) in journal tables of contents and search result pages. When a reader finds the thumbnail interesting, they click to see the full-size version. This two-stage behavior (thumbnail first, full image second) must inform every design decision you make.
Core Design Principles
1. Start with Your Message, Not Your Design
Before opening any design tool, write down your one to three take-home points in plain language. Everything in the graphical abstract should serve those points. A common mistake is to start designing and then add text around the images. This produces cluttered, unfocused visuals.
Recommended approach:
- Write one sentence describing the single most important finding of your study
- Identify the two to three supporting elements (study population, method, secondary outcome) that are essential context for that finding
- Sketch a rough layout on paper before opening any software
2. Color Scheme
Color is one of the most powerful and most misused elements in graphical abstract design. Follow these principles:
- Stick to two to four colors maximum across the entire image
- Choose a solid, neutral background (white or light grey) that contrasts well with text and foreground elements
- Use color to convey meaning (e.g., red for decrease, green for increase, blue for a control group) rather than for decoration
- Test your palette for colorblindness using free tools such as Adobe Color’s accessibility checker or the Coblis color blindness simulator
- Avoid using color as the sole means of conveying information. Pair color changes with icons, labels, or symbols
- If your institution or journal has a brand palette, use it for consistency
For researchers working across multiple papers, defining a personal or lab palette early and reusing it builds visual brand recognition in your field.
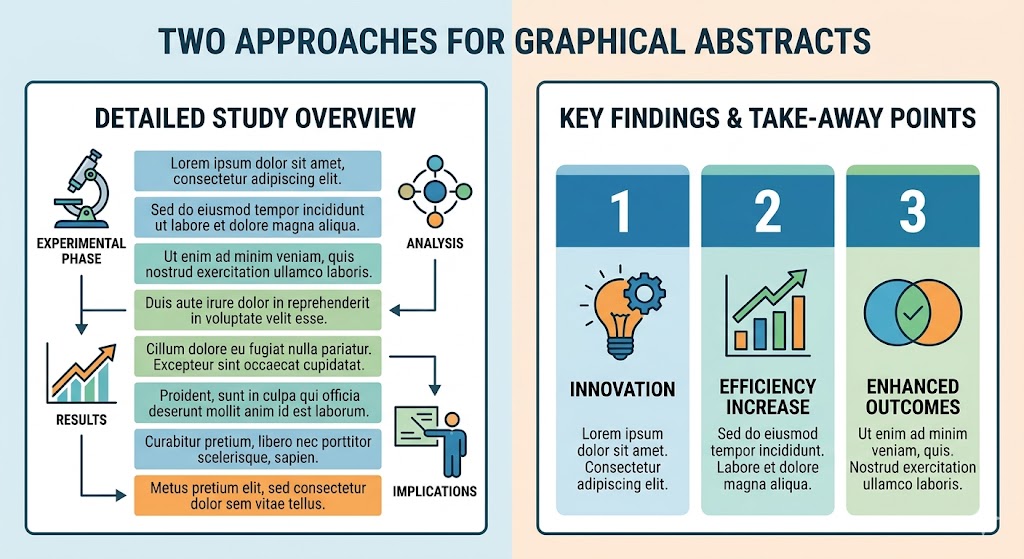
3. Layout and Size
The layout is the organizational structure of your graphical abstract. The most effective layouts are simple and directional. In English-language publishing, readers scan from left to right and top to bottom. Arrange your elements accordingly.
Layout options:
- Linear (left to right): best for sequential processes, cause-and-effect relationships, before/after comparisons
- Linear (top to bottom): effective for vertical processes such as signal cascades or hierarchical data
- Circular: appropriate for cyclical processes such as metabolic pathways, feedback loops, or ecological cycles. Ensure a clear entry point
- Centric (hub and spoke): works for studies that show a central finding with multiple contributing factors
Technical size requirements vary by publisher. Always check your target journal’s author guidelines before designing. The table below shows requirements for major publishers:
| Publisher / Journal Family | Minimum Size (pixels) | Minimum DPI | Preferred File Formats | Aspect Ratio |
| Elsevier (ScienceDirect) | 1328 x 531 px (w x h) | 300 DPI | TIFF, EPS, PDF, MS Office | 5:2 (wide) |
| Cell Press journals | 1200 x 1200 px | 300 DPI | PDF, TIFF, EPS | 1:1 (square) |
| Wiley journals | Check individual journal guide | 300 DPI (photos), 600 DPI (line art) | TIFF, EPS | Varies |
| Springer Nature | Check individual journal guide | 300 DPI | TIFF, EPS, PDF | Varies |
| ACS journals | Check individual journal guide | 300–600 DPI | TIFF, EPS, PDF | Varies |
Note: DPI metadata matters. Some submission systems automatically reject files tagged at 72 DPI (typical screen resolution) even when the pixel count is sufficient. Always export your file at 300 DPI minimum and verify the metadata before submitting.
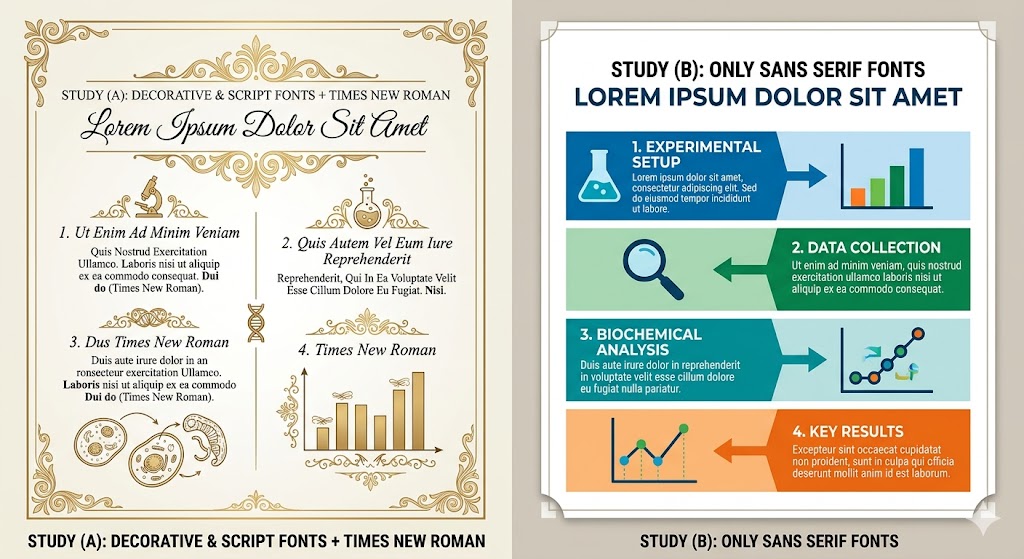
4. Font Size and Style
Text in a graphical abstract must be legible at thumbnail size on a mobile screen. This imposes strict constraints on font choice and size:
- Use sans-serif fonts: Arial, Aptos, Helvetica, or Calibri are all appropriate choices
- Avoid serif fonts such as Times New Roman, which become illegible at small sizes on screen
- Use a minimum font size of 10–12 pt for body labels, and 14 pt or larger for titles
- Limit the number of font sizes to two or three: one for titles, one for labels, and optionally one for annotations
- Bold should be reserved for the single most important piece of text like the main finding or title
- Avoid decorative or script fonts entirely
5. Use of Language and Text Volume
The purpose of a graphical abstract is to communicate visually. Text should support the image, not replace it. Target a word count of 40 to 65 words total. Practical ways to reduce text:
- Replace directional words (“increases,” “decreases”) with upward or downward arrows
- Replace lists of data with pie charts, bar graphs, or simple icons
- Replace “compared to” relationships with side-by-side visual panels
- Use abbreviations where they are widely understood in your field (e.g., HIV, ANOVA, RNA). Define any abbreviations that a reader from a neighboring discipline might not know.
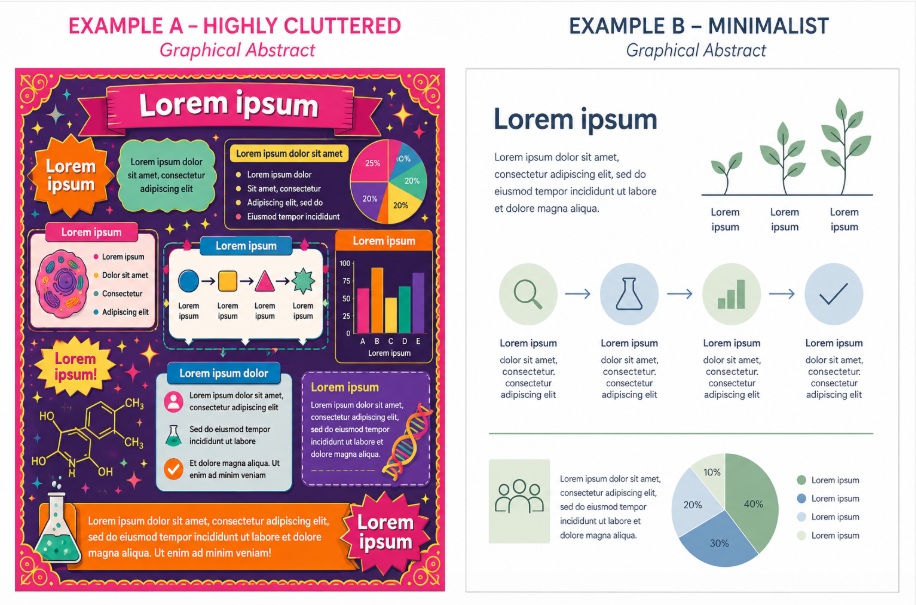
6. Controlling Clutter
Clutter is the single most common problem in graphical abstracts. An overloaded visual sends readers away rather than drawing them in. Guidelines for managing clutter:
- Focus on one to two key points only, not the full study
- Leave 20 to 30 percent of the canvas as intentional white (empty) space
- Remove any element that does not directly support your main message
- Avoid 3D effects, drop shadows, gradients, and decorative borders. They add visual noise without adding information
- Each image should have a clear purpose; remove any image whose removal does not change the meaning
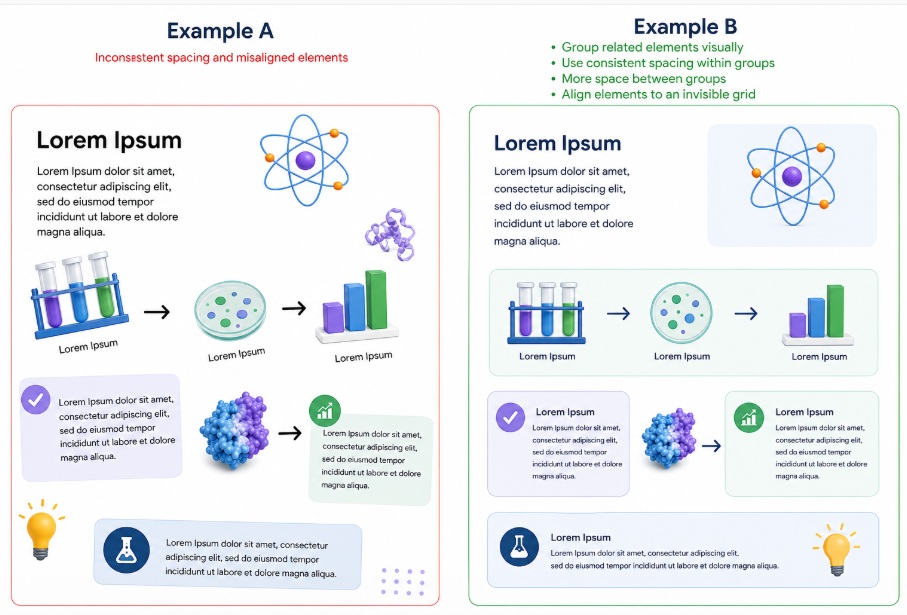
7. Arrangement and Visual Flow
Guide the reader’s eye deliberately:
- Place the research question or study setup on the left or top
- Place the key finding or conclusion on the right or bottom
- Use arrows, lines, or numbering to make the reading order unambiguous
- Group related elements visually. Use consistent spacing within groups and more space between groups
- Align elements to an invisible grid rather than placing them freely. Misaligned elements look accidental and unprofessional
8. Images and Icons
Images and icons should be purposeful, accurate, and copyright-compliant:
- Every image must serve a specific communicative function. Remove purely decorative images
- Photographs, illustrations, and icons drawn from external sources must be properly licensed for academic use
- Even freely available stock images must be acknowledged, with the source reported in the paper or supplementary materials
- All images must comply with the ethical guidelines for images in scientific publishing (no manipulation that misrepresents data)
- When using icons, maintain a consistent visual style. Mixing flat icons with 3D rendered images creates a disjointed appearance
9. Accessibility
Accessibility is no longer optional in scientific publishing. A well-designed graphical abstract should be usable by readers with color vision deficiency or other visual impairments:
- Provide alt-text (a written description of the image) when your journal’s submission system offers this option
- Never convey critical information through color alone — always pair color coding with text labels, patterns, or symbols
- Check your finished design using a color blindness simulation tool before submitting
- The most common form of color blindness is red-green (deuteranopia) — red and green used together to convey contrasting outcomes is a frequent and avoidable problem
- Ensure sufficient contrast between text and background — the WCAG AA standard requires a contrast ratio of at least 4.5:1 for normal text
Tools for Creating Graphical Abstracts
The right tool depends on your field, budget, technical skill, and institutional access. The table below compares the most widely used options:
| Tool | Best For | Scientific Icons | Cost | Skill Level | Publication Export |
| BioRender | Biology, medicine, life sciences | Yes, 50,000+ icons | Free (low-res); paid for publication | Beginner | Not on the free plan |
| Mind the Graph | Interdisciplinary science | Yes, broad library | Free tier; paid plans available | Beginner | Yes |
| Canva | Social media, non-technical summaries | Limited scientific icons | Free tier; Pro available | Beginner | Limited (check DPI) |
| Microsoft PowerPoint | Quick design; familiar interface | No native science icons | Included in MS Office | Beginner | Yes (export as TIFF/PDF) |
| Adobe Illustrator | Professional, print-quality figures | No native science icons | Subscription (~$55/month) | Advanced | Yes (full control) |
| Affinity Designer | Professional vector graphics | No native science icons | One-time purchase (~$70) | Intermediate | Yes |
| Inkscape | Vector graphics (free alternative to Illustrator) | No native science icons | Free (open source) | Intermediate | Yes |
| Google Slides | Collaboration; simple designs | No native science icons | Free | Beginner | Limited (check DPI) |
Copyright and Image Attribution
Copyright compliance is a common area of confusion. Key rules:
- Images you create yourself using design software: you hold the rights and no attribution is needed within the graphical abstract
- Images from BioRender, MindTheGraph, or similar scientific tools: attribution requirements vary by subscription level. Check the platform’s license terms
- Free stock images (Pexels, Unsplash, Pixabay): free to use commercially in most cases but require attribution in the paper or supplementary materials. Check each image’s individual license
- Icons from icon libraries (Noun Project, Flaticon): typically require attribution unless you have a paid license
- Images from other published papers: require permission from the copyright holder (usually the publisher), even if the paper is open access
- AI-generated images: licensing status is legally complex and evolving. Check against your publisher’s guidelines.
In all cases: the source of every externally sourced image element should be reported in the paper, typically in the figure caption, a data availability statement, or supplementary materials.
Getting Feedback Before You Submit
A graphical abstract that seems clear to its creator often confuses a first-time viewer. Build a feedback step into your process:
- Ask a colleague from a different discipline to tell you in one sentence what the graphical abstract communicates. If their summary does not match your intended message, revise
- Ask a colleague to list every element in the image and what each one represents. Any element they cannot interpret or do not mention is a candidate for removal or redesign
- View the image at thumbnail size (scale it down to about 200 pixels high on screen) and assess whether it still looks interesting and coherent
- Check the image on a mobile phone screen. This is how a significant proportion of your readers will first encounter it
- Run the image through a color blindness simulation before finalizing
Pre-Submission Checklist
| Check | Done? |
| Message is limited to one to three take-home points | |
| Color palette uses two to four colors maximum | |
| Design tested for color blindness compatibility | |
| Text uses a sans-serif font at a legible size (minimum 10–12 pt) | |
| Total word count is 40 to 65 words | |
| Layout flows left to right or top to bottom | |
| White space is intentional and sufficient (at least 20%) | |
| All images are original or properly licensed | |
| Image sources are documented for attribution in the manuscript | |
| File exported at the journal’s required pixel dimensions | |
| File exported at a minimum of 300 DPI (verify metadata, not just pixel count) | |
| File saved in the journal’s required format (TIFF, EPS, or PDF for most) | |
| Alt-text written and ready to submit if the journal supports it | |
| Image reviewed at thumbnail size (approx. 200 px high) | |
| Image reviewed on a mobile phone screen | |
| Feedback received from at least one colleague outside the immediate research team | |
| Journal’s AI image policy checked if any AI tools were used |
Frequently Asked Questions
Is a graphical abstract the same as a table of contents (TOC) graphic?
These terms are sometimes used interchangeably, but there are differences in some journals. A TOC graphic typically appears in the print or digital table of contents of a journal issue and may have a square or landscape format. A graphical abstract more often appears on the article’s landing page and in search results. Cell Press uses a square 1200 x 1200 px format, while Elsevier uses a landscape 1328 x 531 px format for its ScienceDirect platform. Check your target journal’s author guidelines as the terms, formats, and technical requirements can differ even within the same publisher’s portfolio.
My journal does not require a graphical abstract. Should I submit one anyway?
Yes, in most cases. Even when graphical abstracts are optional, journals often feature them prominently on article landing pages and in social media promotion. Papers with graphical abstracts tend to receive more views and citations. Submitting one signals that you are thinking about communication and reader engagement, which reviewers and editors notice favorably. The effort required is modest compared to the potential increase in visibility.
Can I reuse a figure from my paper as the graphical abstract?
You can, but it is rarely the best choice. Figures within a paper are designed to be read alongside surrounding text, methods, and captions. A graphical abstract must stand alone. If you choose to reuse a figure, at minimum: remove any axes labels or legends that require the surrounding text to be understood, add a brief title or take-home label, and ensure the image meets the graphical abstract’s technical specifications (DPI, file format, dimensions). In many cases it is more effective to create a bespoke visual that synthesizes your key message rather than presenting raw data.
How do I handle a graphical abstract for a study with multiple outcomes or a very complex methodology?
This is one of the most common frustrations among researchers with multi-arm or multi-outcome studies. The solution is to choose ruthlessly: identify the single most novel or impactful finding and build the graphical abstract around that alone. The graphical abstract is not a summary of every result. It is an advertisement for your paper that makes a reader want to read more. If a reviewer of your draft graphical abstract needs to already understand your paper to interpret the image, the image is too complex.
How should I represent animal or human subjects in my graphical abstract without being misleading?
Use schematic or iconic representations rather than photographs of actual subjects. For human subjects, gender-neutral silhouettes or icons are preferred. Avoid representations that could introduce implicit bias or misrepresent the study population. For animal models, use widely understood scientific illustrations (a mouse icon, for instance) rather than stock photographs of animals, which may suggest a precision of physiological detail that the study does not warrant. Always follow your institution’s and journal’s guidelines on the ethical representation of research subjects in visual communications.
My graphical abstract was rejected by the journal for technical reasons. What are the most common causes?
The five most frequent reasons for technical rejection are:
- DPI metadata tagged at 72 DPI (screen resolution) even when the pixel count is adequate. Always export at 300 DPI and verify the metadata
- Wrong file format. Many journals require TIFF or EPS and will reject JPEG or PNG
- Wrong dimensions or aspect ratio. A square image submitted to an Elsevier journal (which expects a 5:2 landscape format) will be rejected
- Embedded fonts. Some submission systems require fonts to be outlined in vector files; check the journal’s guidelines
- File size too large. Some submission portals have file size limits; compress your TIFF using LZW lossless compression if needed
Further Resources
The following types of resources can support your graphical abstract design process. Search for them by name:
- Your target journal’s Author Guidelines: always the primary reference for technical specifications
- WCAG contrast ratio checker tools (freely available online): for accessibility compliance
- Color blindness simulation tools such as Coblis or Sim Daltonism: for color accessibility testing
- Your institution’s library or research office: for access to institutional software licenses
Need expert help designing a graphical abstract? Editage offers a professional Graphical Abstract Design service with specialists across all scientific disciplines.
This article was originally published on October 16, 2024, and revised on June 11, 2026.