How citation metrics can help you benchmark your research impact

In recent years, many research groups have been working independently to develop metrics that measure the impact of published research. The journal impact factor is a well-known metric used to measure the reputation of journals. However, it does not answer a question that is important to scientists worldwide: How can a researcher’s influence and research impact be measured? One of the most important breakthroughs in this regard was achieved with the introduction of the h-index, named after its inventor Jorge Hirsch.1
How is the h-index calculated?
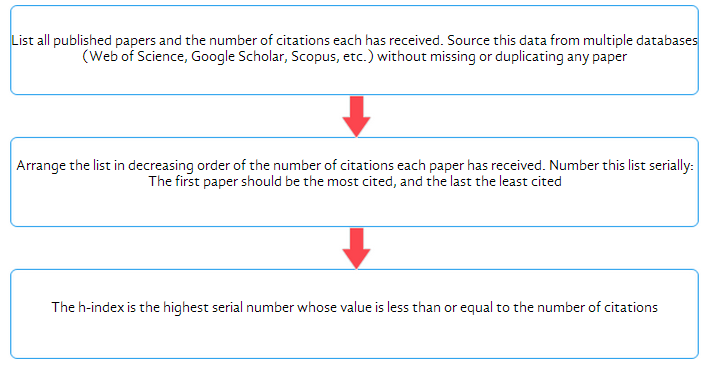
The flowchart below shows a simple method to calculate your h-index.
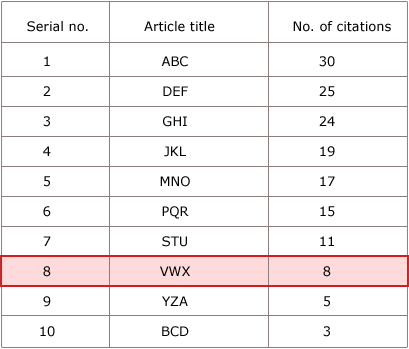
For example, this is how the h-index calculation for researcher A, who has 10 published papers, would look.

Here, 8 is the highest point at which the serial number remains less than or equal to the number of citations. Beyond this point, the serial number exceeds the number of citations, which means that the papers listed subsequently have received few citations or had lower impact. These papers are disregarded as they do not significantly contribute to the overall impact of researcher A. Thus, researcher A’s h-index is 8.
More on the h-index
The h-index tries to capture an optimal balance of researcher output (papers published) and impact (citations received), with the underlying principle being that a good researcher should have both high output and high impact.
Like any citation metric, the h-index is not perfect. The following table lists some of its pros and cons.2
- The h-index is an objective and easy-to-calculate metric.
- It is a more accurate measure of research impact than is the journal impact factor.
- It scores over other single-number metrics like total number of citations, citations per paper, and number of highly cited papers because it combines output and impact.
- It excludes poorly cited papers and thus does not yield an inaccurately inflated score.
- It can be useful for senior researchers with a strong publication record, showing their research and its impact in the most positive light.
- The h-index cannot be used to compare scientists across disciplines, owing to discipline-based variations in research output and citation patterns
- It puts young researchers at a disadvantage because both output and impact are likely to increase with time.
- It overlooks the number of coauthors and their individual contributions, giving equal credit to all authors on a paper.
- It does not disregard self-citations and may thus lead to an inflated score.
- Since it disregards highly cited papers, a researcher with a few high-impact papers may have a similar h-index to one with many low-impact papers.
Alternative citation metrics for researcher impact
To overcome the inherent shortcomings of the h-index, alternative indices, mostly variants of the h-index, have been proposed. They can be used either in isolation or in combination with the h-index score. Here’s a brief description of some of these metrics and how you can best use them.
- g-index: Egghe3 defines the g-index of a set of papers listed in decreasing order of the number of citations each paper has received as g, where g is the highest rank at which the top g papers cumulatively have at least g2 citations. Unlike the h-index, the g-index assigns more weight to highly cited papers, thus overcoming the problem that “once a paper belongs to the top h papers, its subsequent citations no longer count”.4 A drawback of the g index is that a single “blockbuster paper” with an extremely high citation count can inflate its value considerably.
- hg-index: This index is calculated as the geometric mean of the h-index and g-index and thus aims to capture the advantages of both these individual metrics. It also introduces greater granularity than does the h- or g-index individually.5
- m quotient: Proposed by Hirsch1 along with the h index, the m quotient is the h-index score divided by the number of years since a scientist’s first publication.
In addition to the ones listed above, a number of other indices, such as the e-index,6 the Individual h-index,7 and the R- and AR-index,8 that adopt different approaches to measure individual researcher output have been proposed. However, there is no general consensus so far in favor of any specific single-number metric.
Getting the most out of citation metrics
When calculating your citation index, remember to list all your published papers and citation data through searches on multiple databases. You may generate a lower h-index if you use only one database, because each database has different levels of indexing and several citing studies may not appear in the single database you may be referring to. You can extract the data you need for citation analysis from Google Scholar, a free database that indexes academic papers and identifies referenced citations. Use a combination of metrics to provide an accurate depiction of your research standing and negate the limitations of individual metrics. The free Publish or Perish software9 analyzes citation data retrieved from Google Scholar and uses these data to calculate various citation metrics.
Once you have measured your scientific performance, updating your citation metrics becomes as important. You will have to periodically search relevant citation-tracking databases to check if new citations have been added for your publications.10 Remember that upkeep of citation records is not an optional academic exercise. Rather, it is a necessity in today’s academic environment where decisions on hiring, tenure, and grants hinge on your publication record.
Additional measures of impact
Apart from the citation metrics described above, article-level metrics are becoming increasingly popular. Publishers like the Public Library of Science (primarily for biomedical research) and ArXiv (primarily for physics research) provide free data on the volume of online traffic an article attracts in terms of HTML page views, PDF downloads, and XML downloads. You could also look to social bookmarks (offered on CiteULike and Connotea) and comments received as more qualitative indicators of research impact.
Conclusion
Your standing as a researcher depends on the impact you have, and the world is continually looking for new ways to measure that impact. Keep abreast of new developments in the science of citations and other impact measures so that you can use these to your best advantage.
- JE Hirsch (2005). An index to quantify an individual’s scientific research output. Proceedings of the National Academy of Sciences USA, 102: 16569-16572.
- S Alonso, FJ Cabrerizo, E Herrera-Viedma, F Herrera (2009). h-Index: A review focused in its variants, computation and standardization for different scientific fields. Journal of Informetrics, 3: 273-289.
- L Egghe 2006, Theory and practise of the g‐index. Scientometrics, 69: 131‐152.
- L Bornmann, R Mutz, H Daniel (2008). Are there better indices for evaluation purposes than the h-index? A comparison of nine different variants of the h-index using data from biomedicine. Journal of the American Society for Information Science and Technology, 59: 830-837.
- S Alonso, FJ Cabrerizo, E Herrera-Viedma, F Herrera (2010). hg-index: a new index to characterize the scientific output of researchers based on the h- and g-indices. Scientometrics, 82: 391-400.
- Zhang C-T (2009). The e-index, complementing the h-Index for excess citations. PLoS ONE 4: e5429. doi:10.1371/journal.pone.0005429.
- Batista PD, Campiteli MG, Kinouchi O (2006). Is it possible to compare researchers with different scientific interests? Scientometrics, 68: 178-189.
- Jin BH, Liang L, Rousseau R, Egghe L (2007). The R- and AR-indices: complementing the h-index. Chinese Science Bulletin, 52: 855-863.
- Harzing AW (2007). Publish or Perish, available from http://www.harzing.com/pop.htm.
- Dodson MV (2008). Research paper citation record keeping: it is not for wimps. Journal of Animal Science, 86: 2795-2796.


