Understanding the Method of Moments: a handy guide for biomedical researchers
In biomedical research, you often know what type of distribution your data follows. Maybe it’s normally distributed like blood pressure measurements, or it follows an exponential distribution like drug metabolism times. But here’s the challenge: you don’t know the exact parameters (like mean and variance) that define that distribution. The Method of Moments is one of the simplest and oldest statistical tools for estimating these unknown parameters from your sample data.
This guide will walk you through how the method works, when to use it, and how it compares to other approaches.
Jump to Contents
- What is the Method of Moments? Understanding the Core Idea
- Why is it called “Moments”?
- The Mathematical Foundation: Why This Method Works
- What Are the Key Differences Between Moments About the Origin and About the Mean?
- How Does the Method of Moments Work? A Step-by-Step Procedure
- Worked Example 1: Estimating Parameters of a Normal Distribution
- Worked Example 2: Estimating the Rate Parameter of an Exponential Distribution
- Worked Example 3: When You Need Multiple Higher Moments
- When Should You Use the Method of Moments? Comparison with Alternatives
- Quick Decision Guide: Method of Moments or MLE?
- What Makes a Good Method of Moments Estimator? Key Statistical Properties
- Real Biomedical Applications: Where Researchers Actually Use This Method
- What Are the Main Advantages of Using This Method?
- What Are the Key Disadvantages and Limitations?
- Quick Comparison: Advantages vs. Disadvantages of the Method of Moments
- When to Choose Something Else: Comparing Statistical Methods
- Key Takeaway: When Should Biomedical Researchers Use Method of Moments?
- Frequently Asked Questions About Method of Moments
What is the Method of Moments? Understanding the Core Idea
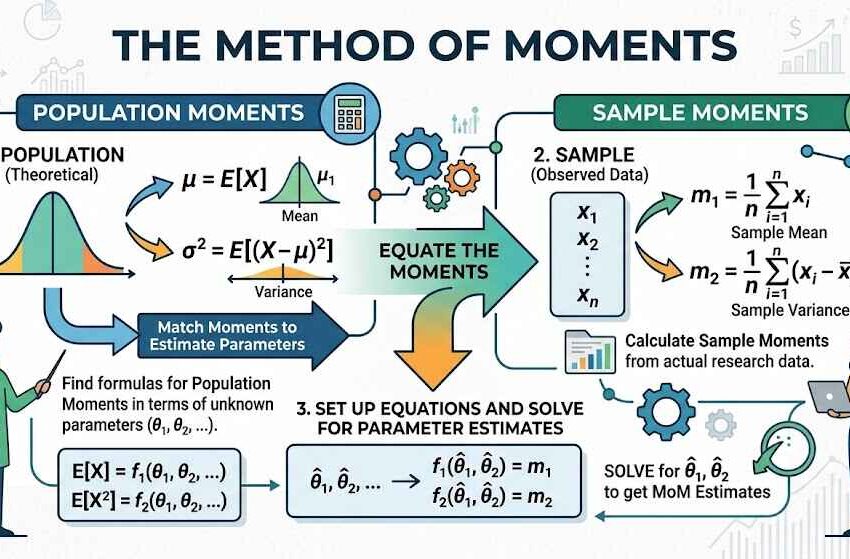
The Method of Moments is a statistical technique for estimating unknown parameters of a probability distribution by matching your sample data to theoretical properties of the distribution.
Here’s the basic concept in one sentence: equate what you observe in your sample (sample moments) with what the theory says you should observe (theoretical moments), then solve for the unknown parameters.
Think of it this way: if you have a distribution with unknown parameters, and you calculate certain statistical properties from your data, these properties should roughly match what the mathematical formula predicts. This matching is the “method.”
Why is it called “Moments”?
In statistics, a moment is a quantitative measure that describes a probability distribution. The term comes from physics, where moments describe how a distribution of mass is positioned relative to a point.
For a random variable X, the k-th moment is simply: E(X^k) (the expected value of X raised to the power k)
Different moments capture different information:
| Moment | Name | What it measures | Formula |
| 1st | Mean | Center/location of the distribution | E(X) = (1/n)∑X_i |
| 2nd (about mean) | Variance | Spread/variability | E[(X-μ)²] = (1/n)∑(X_i – μ)² |
| 3rd (about mean) | Skewness | Asymmetry (left vs right tail) | E[(X-μ)³]/σ³ |
| 4th (about mean) | Kurtosis | Tail heaviness (likelihood of extreme values) | E[(X-μ)⁴]/σ⁴ |
The Mathematical Foundation: Why This Method Works
Before learning the procedure, you need to understand the principle behind it: the Law of Large Numbers.
What is the Law of Large Numbers?
This principle states that as your sample size increases, the characteristics of your sample converge to the true population characteristics. In other words:
- Your sample mean approaches the true population mean
- Your sample variance approaches the true population variance
- And so on for higher-order moments
This is why matching sample moments to theoretical moments makes sense: when you have enough data, these should be approximately equal.
The Basic Logic
- You assume your data follows a specific distribution (e.g., normal distribution)
- That distribution has unknown parameters you want to estimate (e.g., mean μ and standard deviation σ)
- The distribution’s parameters can be expressed as functions of its moments
- You calculate moments from your actual data
- You solve for the parameters
What Are the Key Differences Between Moments About the Origin and About the Mean?
There are two ways to calculate moments:
Moments about the origin (denoted as μ_k’ or E[X^k])
- Calculated as: (1/n)∑X_i^k
- Used directly when the distribution’s origin matters
- Example: First moment about origin is just the mean
Moments about the mean (denoted as μ_k or E[(X-μ)^k])
- Calculated as: (1/n)∑(X_i – μ)^k
- Centered around the distribution’s center
- Used for variance (2nd moment) and higher moments
- More useful for describing the shape of the distribution
For practical purposes in biomedical research, you’ll mostly work with:
- 1st moment about origin (the mean)
- 2nd moment about origin (used to calculate variance)
- Occasionally the 3rd and 4th moments about the mean (for complex distributions)
How Does the Method of Moments Work? A Step-by-Step Procedure
The Method of Moments follows a straightforward 4-step process:
Step 1: Define the Population Moments for Your Distribution
Identify how many parameters you need to estimate. If you need to estimate d parameters, you’ll need to use the first d moments.
Write out the theoretical formulas for these moments based on your assumed distribution.
Example: For a normal distribution with unknown μ and σ²:
- First population moment: E(X) = μ
- Second population moment: E(X²) = μ² + σ²
Step 2: Express Parameters as Functions of Moments
Rearrange the equations to express your unknown parameters as functions of the moments.
Example continuation: Rearranging the equations above:
- μ = E(X)
- σ² = E(X²) – [E(X)]²
Step 3: Calculate Sample Moments from Your Data
Compute the sample moments from your actual data using these formulas:
| Moment | Formula |
| m₁ (1st sample moment) | (1/n)∑X_i |
| m₂ (2nd sample moment) | (1/n)∑X_i² |
| m_k (k-th sample moment) | (1/n)∑X_i^k |
Step 4: Replace Theoretical Moments with Sample Moments and Solve
Substitute your calculated sample moments into the equations from Step 2. This gives you your parameter estimates.
Example continuation: Using actual data where sample mean = 120 and sample mean of squares = 14,410:
- μ̂ = 120
- σ̂² = 14,410 – (120)² = 14,410 – 14,400 = 10
Worked Example 1: Estimating Parameters of a Normal Distribution
Let’s work through a concrete example. Suppose you’ve collected blood pressure measurements from 10 patients and need to estimate the mean and standard deviation of the population.
Your data: 118, 122, 125, 120, 119, 123, 121, 124, 120, 122 (in mmHg)
Step 1: Define population moments
- E(X) = μ
- E(X²) = μ² + σ²
Step 2: Express parameters as functions of moments
- μ = E(X)
- σ² = E(X²) – [E(X)]²
Step 3: Calculate sample moments
| Calculation | Result |
| Sum of X_i | 1,214 |
| n | 10 |
| m₁ = ∑X_i/n | 121.4 |
| ∑X_i² | 147,666 |
| m₂ = ∑X_i²/n | 14,766.6 |
Step 4: Solve for parameters
μ̂ = m₁ = 121.4 mmHg
σ̂² = m₂ – (m₁)² = 14,766.6 – (121.4)² = 14,766.6 – 14,737.96 = 28.64
σ̂ = √28.64 ≈ 5.35 mmHg
Interpretation: Your estimates are that blood pressure in this population has a mean of 121.4 mmHg and standard deviation of 5.35 mmHg.
Worked Example 2: Estimating the Rate Parameter of an Exponential Distribution
Now consider a different scenario. You’re studying drug clearance times, which follow an exponential distribution (one parameter: λ, the rate parameter).
Your data: Clearance times (hours): 2.1, 1.8, 3.2, 1.5, 2.7, 2.2, 1.9, 2.4 (in hours)
Step 1: Define population moment
For an exponential distribution: E(X) = 1/λ
Step 2: Express parameter as function of moment
λ = 1/E(X)
Step 3: Calculate sample moment
m₁ = (2.1 + 1.8 + 3.2 + 1.5 + 2.7 + 2.2 + 1.9 + 2.4)/8 = 17.8/8 = 2.225 hours
Step 4: Solve for parameter
λ̂ = 1/m₁ = 1/2.225 ≈ 0.45 per hour
Interpretation: The drug clears at a rate of about 0.45 per hour on average.
Worked Example 3: When You Need Multiple Higher Moments
Some distributions require more than just the first two moments. Consider a lognormal distribution (common for skewed biomedical data like gene expression or protein concentrations).
The lognormal distribution has two parameters but requires calculating:
- First moment: E(X)
- Second moment: E(X²)
- Sometimes the third moment: E(X³) if the distribution is highly skewed
This example shows why higher moments matter—the first two moments alone may not capture the skewness (asymmetry) of your data.
When Should You Use the Method of Moments? Comparison with Alternatives
The Method of Moments is not always the best choice. Here’s how it compares to Maximum Likelihood Estimation (MLE), the most common alternative:
| Characteristic | Method of Moments | Maximum Likelihood Estimation (MLE) |
| Computation | Simple, uses basic arithmetic | More complex, requires optimization |
| Speed | Very fast, especially for quick estimates | Slower, requires iterative algorithms |
| Efficiency | Less efficient, needs larger samples for same accuracy | More efficient, uses information more effectively |
| Confidence intervals | Requires additional techniques (bootstrap, delta method) | Provides confidence intervals more directly |
| Bias | Can be biased, especially with small samples | Generally unbiased |
| When to use | Quick preliminary analysis, simple distributions | Final analysis, complex models, publication |
| Outlier sensitivity | Very sensitive to outliers | More robust (depending on method) |
Quick Decision Guide: Method of Moments or MLE?
Use Method of Moments if:
- You need a quick, preliminary estimate
- Your distribution is simple (1-2 parameters)
- Your sample size is large (n > 30-50)
- You want to avoid complex calculations
- Your data has no outliers
Use Maximum Likelihood Estimation if:
- You’re doing final statistical analysis for publication
- Your distribution is complex or has multiple parameters
- Your sample size is small to moderate
- You need confidence intervals
- Your data contains outliers
Interestingly, for some distributions (like the normal distribution and Bernoulli distribution), Method of Moments and MLE give identical results.
What Makes a Good Method of Moments Estimator? Key Statistical Properties
When you use Method of Moments, your estimates should have certain desirable properties:
- Consistency: As your sample size increases, your estimate converges to the true parameter value. Method of Moments estimators are generally consistent.
- Unbiasedness: On average, your estimate equals the true parameter. Method of Moments estimators are sometimes biased, especially with small samples.
- Efficiency: Your estimate has small variance; it doesn’t bounce around wildly with different samples. Method of Moments is less efficient than MLE.
- Practical implication: If your sample is large and your distribution is correct, Method of Moments gives you a reasonable estimate. With small samples, it may perform poorly.
Real Biomedical Applications: Where Researchers Actually Use This Method
Application 1: Pharmacokinetics (Drug Clearance)
In drug studies, the time it takes the body to eliminate a drug often follows an exponential or gamma distribution. Researchers use Method of Moments to quickly estimate clearance rates (λ) from concentration measurements.
Why this matters: Knowing clearance rate helps determine appropriate dosing intervals.
Application 2: Gene Expression Data
Gene expression levels are often lognormally distributed, that is, skewed toward lower values. When analyzing microarray or RNA-seq data, Method of Moments can quickly estimate the distribution parameters before conducting more complex analyses.
Why this matters: Understanding the baseline distribution helps identify truly differentially expressed genes.
Application 3: Disease Incidence and Duration
Time to disease onset often follows a Weibull or gamma distribution. Public health researchers use Method of Moments to estimate these parameters from epidemiological data, informing risk predictions.
Why this matters: These parameters help predict disease burden in populations.
Application 4: Measurement Error Models
When you have repeated measurements of a clinical variable, the errors are typically normally distributed. Method of Moments provides a quick estimate of error variance for assessing measurement reliability.
Why this matters: Understanding measurement error is critical for interpreting clinical trials.
What Are the Main Advantages of Using This Method?
| Advantage | Why it matters for your research |
| Simplicity | No complex mathematics or optimization algorithms required. Just algebra and arithmetic |
| Speed | Get parameter estimates in seconds, not minutes or hours |
| Accessibility | Understandable to researchers without advanced statistical training |
| Intuitive | The logic (match what you observe to what theory predicts) is straightforward |
| Flexibility | Works with any distribution type (normal, exponential, Pareto, lognormal, etc.) |
| Low computational demand | Can be done by hand, in a spreadsheet, or with simple scripts |
| Good for exploration | Useful for initial data analysis before more formal inference |
What Are the Key Disadvantages and Limitations?
Understanding the limitations helps you avoid misusing this method.
Limitation 1: Distributional Assumptions Must Be Correct
- The problem: If you assume the wrong distribution, your estimates will be biased and misleading.
- Example: If your data is actually skewed (lognormal) but you assume it’s normally distributed, your estimated mean and variance will be inaccurate.
- How to address: Always test distributional assumptions (normality tests, Q-Q plots, etc.) before using Method of Moments.
Limitation 2: Sensitive to Outliers
- The problem: A few extreme values can disproportionately affect your moments and thus your parameter estimates.
- Example: One unusually high drug concentration can inflate your estimated mean clearance time.
- How to address:
-
- Investigate outliers for data entry errors
- Use robust statistical methods if outliers are genuine
- Consider trimmed moments that exclude extreme values
Limitation 3: Performance with Small Sample Sizes
- The problem: With few observations, sample moments are unstable and may not reflect true population moments.
- Example: With n=5 blood pressure measurements, the sample mean might be far from the true population mean.
- How to address: Use larger samples when possible (typically n > 30 recommended).
Limitation 4: Non-Unique Solutions
- The problem: Sometimes the equations have multiple solutions, and it’s unclear which is the correct estimate.
- Example: When fitting a mixture distribution, Method of Moments might yield multiple mathematically valid answers.
- How to address: Use prior knowledge or additional constraints to select the most scientifically plausible solution.
Limitation 5: Difficulty Estimating Confidence Intervals
- The problem: Method of Moments doesn’t automatically provide confidence intervals for your estimates.
- Example: You estimate μ = 121.4 mmHg, but is this estimate ±1 or ±5?
- How to address:
-
- Use the delta method (propagation of uncertainty formula)
- Use bootstrap resampling
- Use simulation-based approaches
Limitation 6: Challenge with Complex or Multi-Modal Distributions
- The problem: Distributions with multiple peaks or very unusual shapes require higher moments that are unstable to estimate.
- Example: Some immunological responses follow bimodal distributions (responders vs non-responders).
- How to address: Consider mixture models or MLE for complex distributions.
Limitation 7: Less Efficient Than Modern Alternatives
- The problem: Method of Moments needs larger sample sizes than MLE to achieve the same accuracy.
- Example: To get the same precision in your estimate, you might need 40 observations with Method of Moments versus 25 with MLE.
- How to address: For final analyses, consider MLE or Bayesian methods; use Method of Moments for preliminary analysis only.
Quick Comparison: Advantages vs. Disadvantages of the Method of Moments
| Aspect | Advantage (+) | Disadvantage (−) |
| Computational ease | + Simple math | − Requires correct distribution |
| Speed | + Fast calculations | − Less efficient with data |
| Accessibility | + Easy to understand | − Sensitive to outliers |
| Sample size | + Works with small formulas | − Needs larger samples than MLE |
| Distribution variety | + Works with any distribution | − Wrong distribution → wrong estimates |
| Confidence intervals | − Not automatic | − Requires additional techniques |
| Outlier robustness | − Poor | + Rarely recommended for this |
When to Choose Something Else: Comparing Statistical Methods
Method of Moments is one tool among many. Here’s when other approaches might be better:
Choose Maximum Likelihood Estimation (MLE) if:
- You’re preparing a manuscript for publication
- Your sample size is small to moderate (n < 100)
- You have complex distributions or multiple parameters
- You need automatic confidence intervals
- Your data contains outliers
MLE is more statistically efficient and provides better properties for formal inference.
Choose Bayesian Methods if:
- You have strong prior knowledge from previous studies
- You want to incorporate expert opinion into your analysis
- You need to combine multiple sources of information
- Your data are sparse or missing
Bayesian methods combine prior knowledge with data to provide updated probability distributions.
Choose Non-Parametric Methods if:
- You don’t want to assume any specific distribution
- Your data are heavily skewed or contain extreme outliers
- You have ordinal or ranked data (not continuous measurements)
Non-parametric methods make fewer assumptions but provide less specific parameter estimates.
Choose Moment-Matching Techniques (Generalized Method of Moments) if:
- You have complex or dependent data structures
- You’re analyzing time series or longitudinal data
- You need to handle instrumental variables
This is an advanced variant useful in econometrics and complex observational studies.
Key Takeaway: When Should Biomedical Researchers Use Method of Moments?
The Method of Moments is best suited for:
- Initial data exploration: Getting quick parameter estimates to understand your data
- Simple distributions: Normal, exponential, and similar distributions with 1-2 parameters
- Teaching and learning: Understanding parameter estimation concepts
- Preliminary analysis: Before moving to more sophisticated methods
- Educational research: When explaining statistical concepts to students
It is less suitable for:
- Final statistical analysis: Use MLE or Bayesian methods for publication
- Small samples: Unreliable with n < 20
- Outlier-prone data: Too sensitive to extreme values
- Complex models: Mixture models and hierarchical models need MLE
- Formal inference: Confidence intervals and hypothesis tests need additional work
Frequently Asked Questions About Method of Moments
Q1: Is Method of Moments the same as MLE (Maximum Likelihood Estimation)?
No. Method of Moments matches sample statistics to theoretical values. MLE finds parameter values that maximize the probability of observing your specific data. They sometimes give the same answer (like for normal distributions), but often differ. MLE is generally preferred for formal statistical analysis, while Method of Moments is useful for quick exploration.
Q2: How do I know if I have enough data for Method of Moments to work well?
As a rule of thumb, you need n > 30, and ideally n > 50. More importantly, your sample should be large enough that sample moments are stable. Check this by calculating moments for subsets of your data—if the estimates change dramatically with different subsets, your sample is too small. For some distributions (especially highly skewed ones), larger samples like n > 100 are needed.
Q3: What if I calculate moments but get a negative variance, which is impossible?
This is a warning sign that either your distribution assumption is wrong or Method of Moments is inappropriate for your data. This happens sometimes with certain distributions. You should: (1) verify your calculation, (2) plot your data to check distributional assumptions, and (3) consider using MLE or asking a statistician for help.
Q4: Can I use Method of Moments for data that’s missing some values?
No. Standard Method of Moments requires complete data. If you have missing values, you must first handle them (imputation, multiple imputation, or deletion) before calculating moments. Missing data can introduce bias into moment estimates, so consult a statistician if you have many missing values.
Q5: If Method of Moments gives me estimates for mean and variance, can I calculate confidence intervals directly?
Not directly. You need to use additional techniques: the delta method (which uses calculus to propagate uncertainty), bootstrap resampling (resampling from your data repeatedly), or Monte Carlo simulation. These are more complex but give you confidence intervals. Many statistical software packages can do this automatically.
Q6: Should I always use the first two moments, or can I use higher moments?
Use only as many moments as you have parameters to estimate. For a normal distribution (2 parameters: μ and σ²), use 2 moments. For a Pareto distribution (1 parameter), use 1 moment. For highly skewed data like some gene expression data, you might use 3 moments to capture skewness. Using more moments than parameters makes the system over-determined and can give inconsistent results.
References
- Watkins, J. (2024). “Method of Moments.” Introduction to the Science of Statistics. University of Arizona Department of Mathematics. https://math.arizona.edu/~jwatkins/statbook.pdf
- Penn State University Eberly College of Science. (2024). “1.4 – Method of Moments.” STAT 415: Introduction to Mathematical Statistics. Online course material. https://online.stat.psu.edu/stat415/
- GeeksforGeeks. (2025). “Method of Moments.” https://www.geeksforgeeks.org/data-science/generalized-method-of-moments-gmm/
Which statistical method works best for you? Choose wisely, with the help of an experienced biostatistician, under Editage’s Statistical Analysis & Review Services.