- An explanatory variable is what the researcher manipulates or observes to understand its effect; a response variable is what gets measured as a result.
- They map directly to cause (explanatory) and effect (response).
- “Explanatory variable” is preferred over “independent variable” when the variable isn’t fully controlled by the researcher and may be influenced by other factors.
- Multiple explanatory variables can predict a single response variable in more complex models.
- On graphs, the explanatory variable always goes on the X-axis and the response variable on the Y-axis.
- In purely correlational studies, the concepts of explanatory and response variables don’t strictly apply. Both variables may be driven by a confounding third factor.
- Correctly identifying these variables early in study design is critical for choosing the right statistical test and producing valid results.
Glossary of Key Terms
| Term | Definition |
| Explanatory variable | The variable manipulated or observed to explain changes in another variable; also called independent or predictor variable |
| Response variable | The variable measured to capture the effect of the explanatory variable; also called dependent or outcome variable |
| Independent variable | A variable controlled entirely by the researcher in a true experiment |
| Dependent variable | A variable whose value depends on the independent variable |
| Confounding variable | An unmeasured third variable that influences both the explanatory and response variable, distorting results |
| Mediator variable | A variable that transmits the effect of the explanatory variable to the response variable |
| Predictor variable | Another term for explanatory variable, commonly used in regression contexts |
| Causal relationship | A relationship where changes in one variable directly produce changes in another |
| Correlational relationship | An association between two variables that does not imply causation |
| Regression analysis | A statistical method that models the relationship between explanatory and response variables |
What Are Variables in Statistics?
In statistical research, a variable is any characteristic, attribute, or quantity that can be measured, observed, or manipulated. Variables take on different values across observations and that’s what makes them worth studying.
Before diving into explanatory and response variables specifically, it helps to know where they fit in the broader landscape of variable types.
Major Categories of Variables
By data type:
- Quantitative variables: numerical values that represent measurable amounts
- Continuous: can take any value within a range (e.g., blood pressure, temperature)
- Discrete: countable whole numbers (e.g., number of participants, hospital visits)
- Categorical variables: represent groups or categories
- Binary/dichotomous: exactly two categories (e.g., yes/no, treated/untreated)
- Nominal: categories with no inherent order (e.g., blood type, drug type)
- Ordinal: categories with a meaningful order (e.g., pain scale 1–5, education level)
By role in the study:
- Explanatory variable: the presumed cause
- Response variable: the measured effect
- Confounding variable: distorts the relationship between the two main variables
- Mediator variable: explains how the explanatory variable influences the response
- Latent variable: cannot be directly measured; estimated through proxy indicators
What Is an Explanatory Variable?
An explanatory variable (also called an independent variable, predictor variable, or input variable) is the variable a researcher manipulates, controls, or observes in order to understand its effect on the outcome of interest.
It has three defining characteristics:
- Manipulation or observation: In experimental studies, the researcher actively changes this variable. In observational studies, they simply record its existing values.
- Causal priority: It is expected to come before the response variable in a temporal or causal sequence.
- Explanatory power: It is used to explain the variation seen in the response variable.
Synonyms for Explanatory Variable
| Context | Preferred term |
| Experimental research | Independent variable |
| Regression/predictive modeling | Predictor variable |
| Observational research | Explanatory variable |
| Machine learning | Feature / input variable |
What Is a Response Variable?
A response variable (also called a dependent variable, outcome variable, or criterion variable) is the variable that is measured to assess the effect of the explanatory variable. Its value is expected to change in response to variations in the explanatory variable.
It has three defining characteristics:
- Outcome measurement: It captures the result or consequence you care about.
- Temporal sequencing: Changes in the response variable happen after changes in the explanatory variable.
- Dependency: Its variation is explained (partially or fully) by the explanatory variable.
Synonyms for Response Variable
| Context | Preferred term |
| Experimental research | Dependent variable |
| Regression/predictive modeling | Outcome or criterion variable |
| Clinical research | Endpoint or outcome measure |
| Machine learning | Target / output variable |
Explanatory vs. Response Variables: Key Differences
| Feature | Explanatory Variable | Response Variable |
| Role | Cause / input | Effect / output |
| Researcher control | Manipulated or observed | Measured |
| Temporal order | Comes first | Comes after |
| Axis on a graph | X-axis (horizontal) | Y-axis (vertical) |
| Also called | Independent, predictor | Dependent, outcome |
| Changes | Before the outcome | As a result of the cause |
Explanatory Variables vs. Independent Variables: What’s the Difference?
This is one of the most commonly confused distinctions in statistics, and it matters.
- An independent variable is a variable that is entirely controlled by the researcher. It is not influenced by any other variable in the study. This is most accurate in controlled laboratory experiments where the researcher sets the exact values of the variable.
- An explanatory variable is a broader, more flexible term used especially when the variable in question is observed rather than fully controlled, and may itself be influenced by other variables.
When to use “explanatory variable” over “independent variable”
Use explanatory variable when:
- The study is observational (not a controlled experiment)
- Two or more predictor variables are correlated with each other
- The variable cannot be fully isolated from outside influence
- You’re working in regression analysis or modeling contexts
Example:
In a study examining whether gender identity and risk perception predict stress reactions, gender identity and risk perception are correlated with each other, meaning neither is truly “independent.” Calling them explanatory variables is more accurate.
How to Identify Explanatory and Response Variables
Follow these steps when designing or reading a study:
- State the research question clearly: e.g., “Does hours of sleep affect exam performance?”
- Identify what is being manipulated or observed: this is your explanatory variable (hours of sleep)
- Identify what is being measured as an outcome: this is your response variable (exam score)
- Ask the causal direction question: “Which variable changes because of the other?”
- Check for confounders: are there other variables that might explain the relationship?
Quick-reference test
Ask: “Does X cause or explain Y?”
- If yes → X is explanatory, Y is response
- If the direction is unclear → you may be in correlational territory, not causal
Examples of Explanatory and Response Variables
Biomedical Research
| Research Question | Explanatory Variable(s) | Response Variable |
| Does vitamin C supplementation improve lipid profile? | Vitamin C dose | HDL, LDL, triglyceride levels |
| Does a new drug reduce blood pressure? | Drug type (new vs. standard) | Systolic/diastolic blood pressure |
| Does type of fertility treatment affect conception rates? | Type of fertility treatment | Fertility rate |
| Does coffee bean origin affect hyperactivity? | Region of coffee bean origin | Hyperactivity level |
Social Science and Education
| Research Question | Explanatory Variable(s) | Response Variable |
| Does academic motivation predict GPA? | Academic motivation score | GPA at year end |
| Does a new teaching method reduce anxiety? | Lesson type (new vs. old) | Student anxiety level |
| Does study time predict exam performance? | Hours studied per week | Exam score |
| Can height predict age in students? | Height | Age |
Business and Technology
| Research Question | Explanatory Variable(s) | Response Variable |
| Does advertising spend drive sales? | Advertising budget | Units sold |
| Does app load time affect user satisfaction? | App load time (seconds) | User satisfaction score |
| Does film budget predict box office success? | Production/marketing spend | Box office revenue |
What to Do When You Have Multiple Explanatory Variables (Multivariate Models)
In many real-world studies, a single explanatory variable rarely tells the whole story. Multiple factors often work together to influence the response variable, and ignoring them can lead to biased, incomplete, or misleading results.
| Research Question | Explanatory Variables | Response Variable |
| What predicts financial risk-taking behavior? | Overconfidence, risk perception | Investment choices |
| Does weather affect Covid-19 transmission? | Temperature, humidity, wind speed | Reproduction rate (R-value) |
Why Multiple Explanatory Variables Are Needed
- A single explanatory variable may explain only a small fraction of the variation in the response variable
- Other variables may confound the relationship if left unaccounted for
- Real phenomena (disease progression, consumer behavior, academic performance) are almost always multi-causal
- Including relevant variables improves model accuracy and predictive power
What Kind of Statistical Tests Are Needed For Multiple Explanatory Variables?
| Approach | When to Use | What It Does |
| Multiple linear regression | Continuous response variable | Models the combined effect of all explanatory variables on the response |
| Logistic regression | Binary response variable (yes/no) | Predicts probability of an outcome from multiple predictors |
| ANCOVA | Categorical + continuous explanatory variables | Controls for continuous covariates while comparing groups |
| Multivariate regression | Multiple response variables | Models several outcomes simultaneously |
| Structural equation modeling (SEM) | Complex causal pathways | Handles mediators, moderators, and latent variables together |
Key Steps to Follow
- Check for multicollinearity: when two or more explanatory variables are highly correlated with each other, it becomes hard to isolate each variable’s individual effect. Assess multicollinearity using the Variance Inflation Factor (VIF); a VIF above 5–10 signals a problem.
- Don’t over-include variables: adding too many predictors relative to sample size causes overfitting. Follow the rule of thumb: at least 10–20 observations per explanatory variable.
- Standardize variables if needed: when explanatory variables are measured on very different scales (e.g., age in years vs. income in thousands), standardizing them makes regression coefficients directly comparable.
- Test for interaction effects: two explanatory variables may not just independently affect the response; they may interact, meaning the effect of one depends on the level of the other (e.g., a drug’s effect may differ by age group).
- Report adjusted effects: in multiple regression, each coefficient represents the effect of one explanatory variable while holding all others constant. Always frame results this way.
How to Interpret Results
| Output | What It Tells You |
| Individual coefficient (β) | Effect of one explanatory variable on the response, controlling for the others |
| p-value per variable | Whether each variable’s contribution is statistically significant |
| R² (overall model) | Proportion of total variation in the response variable explained by all explanatory variables combined |
| Adjusted R² | R² penalized for the number of variables. Use this to compare models with different numbers of predictors |
| VIF | Whether multicollinearity is inflating your standard errors |
The goal is a parsimonious model: one that includes all variables that meaningfully contribute to explaining the response, and excludes those that don’t.
The Role of Confounding Variables
What is a confounding variable?
A confounding variable is one that is associated with both the explanatory and the response variable, creating a misleading appearance of a direct relationship.
- Example: A study finds that shoe size and reading ability are correlated in children. However, both are influenced by age (the confounder). Shoe size doesn’t cause reading ability.
- In purely correlational studies, explanatory and response variable labels are not truly meaningful; you cannot assign causal direction without ruling out confounders.
- Confounders can be controlled for through study design (e.g., randomization) or statistical adjustment (e.g., multiple regression).
How to Visualize Explanatory and Response Variables
One of the clearest ways to present these variables is through graphs. The convention is consistent across all study types:
- Explanatory variable → X-axis (horizontal)
- Response variable → Y-axis (vertical)
Choosing the Right Graph Type
| Variable Types | Recommended Graph |
| Both variables are quantitative (continuous) | Scatterplot |
| Quantitative explanatory, quantitative response (over time) | Line graph |
| Categorical explanatory, quantitative response | Bar graph or box plot |
| Categorical explanatory, categorical response | Grouped bar chart or mosaic plot |
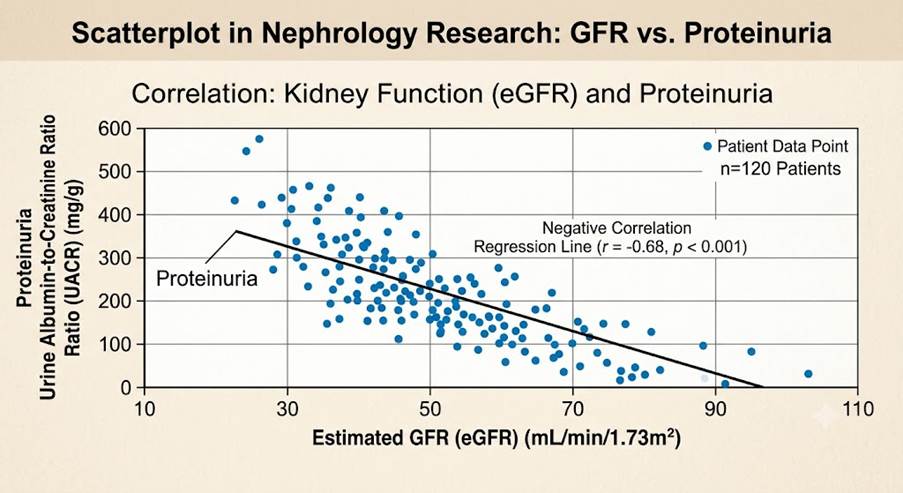
What to Look for in a Scatterplot
When you plot explanatory vs. response variables, assess:
- Direction: Is the trend positive (both increase together) or negative (one increases as the other decreases)?
- Form: Is the relationship linear or non-linear (curved)?
- Strength: How tightly clustered are the points around the trend line? (Weak, moderate, or strong)
- Outliers: Are there bivariate outliers that deviate from the main pattern?
Explanatory and Response Variables in Regression Analysis
Regression analysis is the most common statistical method used when working with explanatory and response variables. It quantifies the relationship between them.
Types of Regression by Variable Count
| Regression Type | Explanatory Variables | Response Variables |
| Simple linear regression | 1 (continuous) | 1 (continuous) |
| Multiple linear regression | 2+ (continuous or categorical) | 1 (continuous) |
| Logistic regression | 1+ | 1 (binary/categorical) |
| Multivariate regression | 2+ | 2+ |
- In simple linear regression, the model takes the form: Y = a + bX, where X is the explanatory variable and Y is the response variable.
- The regression coefficient (b) tells you how much the response variable changes for each one-unit increase in the explanatory variable.
- R² (coefficient of determination) tells you what percentage of variation in the response variable is explained by the explanatory variable(s).
Explanatory and Response Variables in Experimental vs. Observational Studies
| Aspect | Experimental Study | Observational Study |
| Researcher control | High: manipulates explanatory variable | Low: observes natural variation |
| Preferred terminology | Independent / dependent variable | Explanatory / response variable |
| Causal inference | Stronger (especially with randomization) | Weaker: correlation, not causation |
| Example | Clinical trial comparing two drug dosages | Survey linking income to health outcomes |
How to Set Variables in Your Own Research
- Define your research objective precisely: what relationship are you investigating?
- Identify your explanatory variable(s): what are you manipulating or observing as the potential cause?
- Identify your response variable(s): what outcome are you measuring?
- Identify potential confounders: what else might affect the response variable?
- Choose your study design: experimental (randomized) or observational?
- Select appropriate statistical methods: regression, ANOVA, t-test, etc., based on variable types
- Plan your visualization: decide on graph type based on the variable types
Common mistakes to avoid
- Confusing explanatory and response variables in the research question
- Treating a correlational association as a causal relationship
- Forgetting to account for confounding variables
- Mislabeling an explanatory variable as “independent” when it’s influenced by other variables
- Using a graph type that doesn’t match your variable types
Frequently Asked Questions
Can a variable be both explanatory and response in the same study?
Yes: this is common in mediation analysis. For example, if you’re studying whether exercise (explanatory) reduces depression via improved sleep quality (mediator), sleep quality acts as a response to exercise and simultaneously as an explanatory variable for depression. This is also seen in path analysis and structural equation modeling (SEM).
How many explanatory variables can a study have?
There is no strict limit. Simple studies use one explanatory variable, but multiple regression models routinely include 5, 10, or more explanatory variables simultaneously. However, adding too many explanatory variables relative to your sample size risks overfitting: where the model fits the sample data well but generalizes poorly to new data. A general rule of thumb is to have at least 10–20 observations per explanatory variable in linear regression.
Do explanatory and response variables apply to qualitative/non-quantitative research?
Strictly speaking, explanatory and response variables are concepts from quantitative research. In qualitative research, equivalent concepts exist, such as the phenomenon being studied (analogous to the response) and the context or factors shaping it (analogous to explanatory variables). But they are not referred to using this terminology and are not subjected to statistical testing.
What happens if you swap the explanatory and response variables in a regression?
Swapping the variables produces a different model with a different regression equation and different coefficients. While in correlation the relationship is symmetric, in regression the direction matters: predicting Y from X is mathematically different from predicting X from Y. Swapping the variables can produce a model that is statistically valid but scientifically meaningless if it violates causal logic.
How do explanatory and response variables relate to hypothesis testing?
In hypothesis testing, the null hypothesis typically states that the explanatory variable has no effect on the response variable (e.g., there is no difference in blood pressure between treatment groups). The alternative hypothesis states that it does. The p-value you calculate tells you the probability of observing your results if the null hypothesis were true: it does not confirm causation, only whether the association is statistically significant.
Can a categorical variable be an explanatory variable in regression?
Yes. Categorical explanatory variables are incorporated into regression models using dummy coding (also called indicator variables). For example, if the explanatory variable is “treatment group” with three levels (A, B, C), it is converted into two binary dummy variables (e.g., “is group B?” and “is group C?”), with group A as the reference. This allows the model to estimate the effect of each category on the response variable.
Need expert help identifying your study variables and choosing the right statistical approach? Explore Editage’s Statistical Analysis & Review Services.


Comment