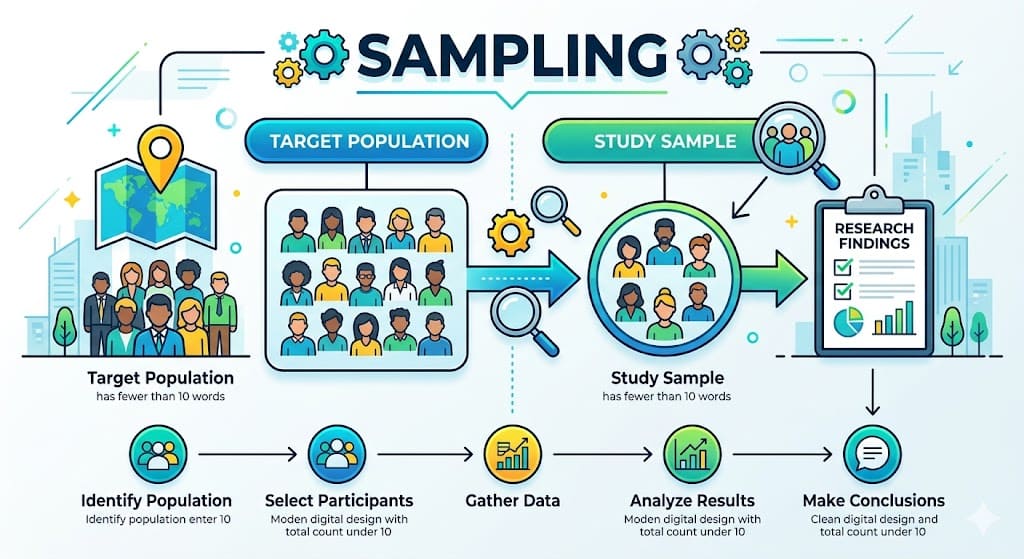
Bias in Data Collection: Types, Examples, and Preventive Measures
In this article you’ll learn,
- What Is Bias in Research?
- Selection Bias
- Attrition Bias (Loss-to-Follow-Up Bias)
- Information Bias
- Confounding
- Publication Bias and Reporting Bias
- Bias Specific to Study Designs
- Tools to Assess Bias in Biomedical Research
- Generalizability (External Validity)
- Summary Table: Bias at a Glance
- Frequently Asked Questions
What Is Bias in Research?
In quantitative research, bias refers to any systematic error that causes a study estimate to deviate from the true value in a consistent direction. Unlike random error (which can be reduced by increasing sample size), bias cannot be averaged away. It skews results toward or away from the truth regardless of how large your N is.
Biases are broadly grouped into three families:
| Bias Family | Definition | Occurs During |
| Selection bias | Systematic differences in who is included in the study | Recruitment, enrolment |
| Information bias | Systematic errors in how data is measured or recorded | Data collection, recall |
| Confounding | A third variable distorts the exposure–outcome relationship | Analysis and interpretation |
Each study design has its own vulnerability profile. The table below summarizes which biases are most dangerous for common biomedical designs.
| Study Design | High-Risk Biases |
| Randomized Controlled Trial (RCT) | Attrition bias, performance bias, detection bias |
| Cohort Study | Attrition bias, healthy worker effect, confounding |
| Case-Control Study | Recall bias, selection bias, Berkson’s bias |
| Cross-Sectional Study | Prevalence-incidence (Neyman) bias, non-response bias |
| Systematic Review/Meta-Analysis | Publication bias, reporting bias |
Selection Bias
What is selection bias?
Selection bias occurs when the participants included in a study are systematically different from those who are not included, in a way that is related to both the exposure and the outcome.
Subtypes and Examples
Berkson’s Bias (Hospital Admission Bias)
- Occurs in case-control studies when cases and controls are both drawn from hospital populations
- Classic example: Early studies linking smoking to lung cancer conducted in hospitals found attenuated associations because hospitalized controls were also more likely to be smokers (for other conditions), making the smoking rate among controls appear higher than in the general population
- Prevention: Use population-based controls drawn from the same source population as cases
Healthy Worker Effect
- Seen in occupational cohort studies
- Employed individuals are systematically healthier than the general population (as people with disabilities or chronic illnesses are more frequently unemployed)
- Example: Studies comparing mortality in asbestos factory workers to the general population underestimated occupational risk because the general population had a higher baseline mortality
- Prevention: Use an internal reference group (e.g., unexposed workers at the same plant) rather than the general population
Volunteer Bias
- People who enroll in studies differ systematically from those who decline
- Trial participants tend to be more health-conscious, more educated, and more adherent
- Example: Women who enrolled in the Women’s Health Initiative hormone therapy trial were healthier than the general postmenopausal population, limiting generalizability
- Prevention: Report enrollment rates and compare baseline characteristics of enrollees vs. decliners; use probability sampling where possible
Non-Response Bias
- In surveys and cross-sectional studies, individuals who complete the survey differ from those who do not
- Example: In a survey on alcohol use among medical students, heavy drinkers may be less likely to respond, leading to underestimation of prevalence
- Prevention: Maximize response rates through reminders, incentives, and convenient formats; use follow-up sampling of non-responders to characterize differences
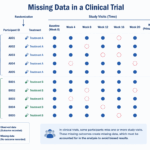
Attrition Bias (Loss-to-Follow-Up Bias)
What is attrition bias?
Attrition bias occurs when participants who drop out of a longitudinal study differ systematically from those who remain, and this differential dropout is related to the exposure or outcome of interest.
Study Designs Most Affected
- RCTs: Participants lost from the treatment arm may differ from those lost from the control arm
- Cohort studies: Sicker participants or those with the outcome of interest may be less likely to attend follow-up visits
Examples
- In an HIV antiretroviral therapy trial, participants experiencing drug side effects (the treatment group) are more likely to drop out than those on placebo. If the analysis only includes completers, the treatment will appear safer and more effective than it actually is
- In a long-term cardiovascular cohort, participants who die before the final follow-up cannot provide endpoint data. If deaths are disproportionately in the high-exposure group, the surviving cohort’s risk estimate is biased downward
Prevention Strategies
| Strategy | Description |
| Intention-to-treat (ITT) analysis | Analyze all randomized participants in their original group regardless of adherence or dropout |
| Multiple imputation | Statistically impute missing outcome data using observed predictors |
| Sensitivity analysis | Test best-case/worst-case scenarios for missing data |
| Minimize dropout prospectively | Collect contact information, use multiple follow-up modes, offer convenience visits |
| Track reasons for dropout | Distinguish missing-at-random from missing-not-at-random |
Key rule: If >20% of participants are lost to follow-up in an RCT and the proportion differs between arms, the validity of the trial is seriously compromised.
Survivorship Bias
What is survivorship bias?
Survivorship bias is a specific form of selection bias in which only “survivors”: those who made it through a process: are available for study, while those who did not survive are invisible to the researcher. This leads to systematically optimistic conclusions.
Examples
- Cancer treatment studies: Analyses of long-term cancer survivors overestimate treatment benefit because patients who died early (often those with the worst prognosis or most severe side effects) are excluded by definition
- Drug safety registries: Post-marketing surveillance of patients currently on a drug excludes all patients who discontinued it due to adverse events: making the drug’s safety profile look better than it is
- Surgical outcomes: Studies examining the functional outcomes of patients who survived major surgery exclude those who died perioperatively, biasing outcomes toward favorable results
Prevention Strategies
- Include all eligible participants from the point of exposure, not just those who remain alive at a later time point
- Use time-to-event (survival) analysis methods (Kaplan-Meier, Cox regression) that properly handle deaths and dropouts as events
- Clearly define the inception cohort and report on all participants from that point forward
Information Bias
What is information bias?
Information bias arises from errors in measuring exposures, outcomes, or covariates. When these errors are systematic, they distort the estimated association. The different types of information bias are
Recall Bias
- Definition: Participants who experienced an adverse outcome (cases) tend to remember and report past exposures differently from those who did not (controls)
- Study design: Classic problem in retrospective case-control studies
- Biomedical example: Mothers of children with birth defects may more carefully recall first-trimester drug exposures than mothers of healthy children, inflating the apparent exposure rate among cases and producing a spurious association
- Prevention:
- Use objective records (pharmacy databases, medical charts) instead of self-report
- Use prospective designs where exposure is recorded before outcome occurs
- Blind interviewers to case-control status
Misclassification Bias
- Non-differential misclassification: Exposure or outcome is measured with equal error in both groups → typically biases the association toward the null (underestimates effect)
- Differential misclassification: Measurement error differs between groups → can bias in any direction
- Example: Using self-reported dietary fat intake (a notoriously imprecise measure) equally in both cases and controls will attenuate a true association between fat intake and colorectal cancer
- Prevention: Use validated instruments, biomarkers, or objective measures; conduct reliability studies within your sample
Observer/Interviewer Bias
- When the person collecting data knows the participant’s exposure or disease status and unconsciously applies different scrutiny
- Prevention: Blind data collectors to participant status; use standardized instruments and training protocols
Confounding
What is confounding?
A confounder is a variable that is associated with both the exposure and the outcome, and is not on the causal pathway between them. Confounding distorts the apparent exposure–outcome relationship.
Example
- In observational studies, coffee drinking appeared to be associated with increased lung cancer risk. The confounder was smoking: coffee drinkers were more likely to smoke, and smoking causes lung cancer. Once smoking was adjusted for, the coffee–cancer association disappeared
- In cohort studies of exercise and cardiovascular disease, healthier individuals are both more likely to exercise and less likely to develop CVD: confounding by baseline health status can make exercise appear more protective than it is
Prevention Strategies
| Method | Stage | Notes |
| Randomization | Design | Distributes known and unknown confounders equally across groups; only feasible in RCTs |
| Restriction | Design | Limit enrollment to one level of confounder (e.g., non-smokers only); reduces generalizability |
| Matching | Design | Match cases to controls on potential confounders; requires conditional analysis |
| Multivariable regression | Analysis | Adjust for measured confounders statistically |
| Propensity score methods | Analysis | Estimate probability of exposure; balance groups post-hoc |
| Instrumental variable analysis | Analysis | Use a variable that affects exposure but not outcome directly |
Important limitation: Statistical adjustment can only control for measured confounders. Unknown or unmeasured confounders remain a threat in all observational designs.
Publication Bias and Reporting Bias
What is publication bias and reporting bias?
- Publication bias: Studies with statistically significant or positive results are more likely to be published than null or negative studies
- Outcome reporting bias: Researchers selectively report outcomes that were statistically significant while burying non-significant ones
Example
- A landmark analysis in psychiatry found that antidepressant trials submitted to the FDA showed effect sizes roughly twice as large in published literature as in the complete trial registry, because negative trials were rarely published or were published with outcomes reframed positively
Prevention Strategies
- Trial registration (e.g., ClinicalTrials.gov) before data collection: compares pre-specified vs. reported outcomes
- Funnel plot asymmetry in meta-analyses to detect publication bias
- CONSORT, STROBE, PRISMA reporting guidelines enforce completeness
- All-trials initiatives and data sharing mandates by funders
Bias Specific to Study Designs
We now look at which study design is subject to which type of bias
Cohort Studies
| Bias | Description | Example |
| Healthy worker effect | Employed cohort is healthier than general population | Occupational cancer studies |
| Attrition bias | Differential loss to follow-up | Long-term cardiovascular studies |
| Incubation bias | Exposure window is misspecified relative to disease latency | Industrial chemical exposures and cancer |
| Confounding by indication | Sicker patients receive different treatments | Pharmacoepidemiology |
Case-Control Studies
| Bias | Description | Example |
| Recall bias | Cases remember exposures more vividly | Birth defect and drug exposure studies |
| Berkson’s bias | Hospital-based controls unrepresentative | Early smoking–lung cancer studies |
| Neyman (Prevalence-Incidence) bias | Missing fatal or resolved cases | Studying MI risk factors using survivors only |
| Interviewer bias | Differential probing by case status | Unblinded interviews |
Randomized Controlled Trials
| Bias | Description | Example |
| Allocation concealment failure | Assignment can be predicted before enrollment | Non-sealed allocation envelopes |
| Performance bias | Participants/providers behave differently knowing allocation | Open-label surgical trials |
| Detection bias | Outcomes assessed differently by arm | Unblinded outcome assessment |
| Attrition bias | Differential dropout by arm | Drug side-effect trials |
Tools to Assess Bias in Biomedical Research
Why Formal Assessment Tools Matter
- Informal, subjective appraisal of study quality is itself prone to bias
- Structured tools standardize the evaluation process across reviewers
- Most journals, systematic reviews, and funding bodies now require formal bias assessment
- Tools vary by study design so using the wrong tool for a design produces misleading appraisals
Cochrane Risk of Bias Tool (RoB 2): For Randomized Controlled Trials
The most widely used tool for clinical trials, developed by the Cochrane Collaboration. The current version (RoB 2) evaluates five domains:
| Domain | What It Assesses | Example Red Flags |
| Randomization process | Was allocation truly random and concealed? | Quasi-randomization (by date of birth, alternating), unsealed envelopes |
| Deviations from intended interventions | Were co-interventions or unblinding a problem? | Open-label design with subjective outcomes |
| Missing outcome data | Was attrition differential or substantial? | >20% dropout, dropout reasons differ by arm |
| Outcome measurement | Was outcome assessed without knowledge of allocation? | Unblinded assessors for subjective endpoints |
| Selection of reported results | Were outcomes pre-specified and fully reported? | Protocol–publication discrepancies |
- Each domain is rated: Low risk / Some concerns / High risk
- An overall judgment is derived, so a single high-risk domain can render the whole trial high risk
- RoB 2 has specific versions for cluster RCTs and crossover trials
- Freely available via the Cochrane training website with a companion Excel tool
ROBINS-I for Non-Randomized (Observational) Studies
Risk Of Bias In Non-randomized Studies of Interventions (ROBINS-I) is the observational counterpart to RoB 2
- Evaluates 7 domains:
- Confounding
- Selection of participants
- Classification of interventions
- Deviations from intended interventions
- Missing data
- Measurement of outcomes
- Selection of reported results
- Ratings: Low / Moderate / Serious / Critical risk of bias
- Critically, it benchmarks the observational study against a hypothetical well-conducted RCT on the same question
- Best suited for cohort and controlled before-after studies; less appropriate for case-control designs
Newcastle-Ottawa Scale (NOS) for Cohort and Case-Control Studies
A simpler, widely used tool that uses a star-based scoring system (0–9 stars)
For cohort studies, evaluates:
- Selection of the exposed and unexposed cohorts
- Comparability of cohorts on confounders
- Assessment of outcome and adequacy of follow-up
For case-control studies, evaluates:
- Adequacy of case definition and selection
- Selection of controls (same source population?)
- Comparability on key confounders
- Ascertainment of exposure (record-based vs. self-report)
- Limitations:
- Criticized for poor inter-rater reliability
- “Stars” can create a false sense of precision
- Does not assess reporting bias or statistical analysis quality
- Best used alongside, not instead of, domain-specific judgment
AXIS Tool for Cross-Sectional Studies
This appraisal tool for cross-sectional studies is a 20-item checklist covering:
- Clear study objectives and appropriate design justification
- Sample size and power calculation
- Representative sampling strategy and response rate
- Standardized, validated exposure and outcome measurement
- Non-response bias assessment
- Appropriate statistical methods for the design
- Conflict of interest disclosure
GRADE Framework for Bodies of Evidence
GRADE (Grading of Recommendations, Assessment, Development and Evaluations) operates at the level of a body of evidence, not a single study. It is used in systematic reviews and clinical guidelines.
- Starts high for RCT evidence, starts low for observational evidence
- Evidence quality is downgraded for:
- Risk of bias (using RoB 2 / ROBINS-I)
- Inconsistency across studies
- Indirectness (population, intervention, or outcome differs from question)
- Imprecision (wide confidence intervals)
- Publication bias
- Evidence quality is upgraded for observational studies showing:
- Large magnitude of effect
- Dose-response relationship
- All plausible confounders that would attenuate the effect
- Final ratings: High / Moderate / Low / Very Low certainty of evidence
QUADAS-2 for Diagnostic Accuracy Studies
QUADAS-2 was specifically designed for studies evaluating diagnostic tests, which is an area where general tools perform poorly
- 4 domains:
- Patient selection (was there spectrum bias? consecutive enrollment?)
- Index test (was the test interpreted without knowledge of reference standard?)
- Reference standard (is it truly the gold standard? was it applied to all?)
- Flow and timing (were all patients included in the analysis? similar timing?)
- Each domain rated: Low / High / Unclear risk of bias
- An additional applicability assessment asks whether findings apply to the review question
Funnel Plot + Egger’s Test for Publication Bias in Meta-Analyses
- A funnel plot plots each study’s effect size against its standard error (or sample size)
- If there is no publication bias, the plot should be symmetrical (an inverted funnel)
- Asymmetry suggests that small, negative, or null studies are missing: a hallmark of publication bias
- Egger’s test quantifies funnel plot asymmetry statistically
- Limitations:
- Require ≥10 studies to be interpretable
- Asymmetry can also arise from true heterogeneity or chance
- Cannot distinguish publication bias from other small-study effects
Quick Reference: Which Tool for Which Design?
| Study Design | Recommended Tool |
| Randomized controlled trial | Cochrane RoB 2 |
| Non-randomized intervention study | ROBINS-I |
| Cohort study | Newcastle-Ottawa Scale (NOS) |
| Case-control study | Newcastle-Ottawa Scale (NOS) |
| Cross-sectional study | AXIS Tool |
| Diagnostic accuracy study | QUADAS-2 |
| Systematic review/clinical guideline | GRADE Framework |
| Meta-analysis (publication bias) | Funnel plot + Egger’s test |
Practical tip for students and researchers: Most thesis committees and journal reviewers expect you to pre-specify which bias assessment tool you will use in your systematic review or study protocol, before data collection or screening begins. Choosing the tool post-hoc, or after seeing the results, is itself a form of reporting bias.
Generalizability (External Validity)
What Is Generalizability?
Generalizability, also called external validity, refers to the extent to which study findings can be applied to populations, settings, and conditions beyond those of the original study. A study can be internally valid (free from bias in its own population) yet have poor generalizability.
External validity is distinct from, but dependent on, internal validity:
- A biased study cannot be generalized
- An unbiased study may still not generalize if the study population is highly selective
Factors That Limit Generalizability
- Narrow eligibility criteria: Highly restrictive inclusion/exclusion criteria improve internal validity but produce findings applicable only to a narrow population
- Example: Most early cardiovascular drug trials enrolled primarily middle-aged white men; results have limited applicability to women, elderly patients, and non-White populations
- Academic medical center populations: Tertiary care centers see more severe or complex cases; findings may not apply to community settings
- Adherent trial participants: Volunteers in RCTs tend to be more adherent than real-world patients, overestimating effectiveness under routine conditions (a gap sometimes called the efficacy–effectiveness gap)
- Short follow-up periods: A trial showing benefit at 12 months may not reflect long-term risks or waning efficacy
- Hawthorne effect: Participants change behavior simply because they are being observed, inflating measured outcomes beyond what routine care would achieve
Assessing and Improving Generalizability
| Approach | How It Helps |
| Pragmatic trial design | Broad eligibility, real-world settings, routine care comparators |
| Subgroup analyses | Assess whether effects differ by sex, age, race/ethnicity, comorbidities |
| Replication across populations | Findings replicated in diverse settings carry stronger generalizability |
| Registry-based studies | Use of real-world data (EHRs, claims data) to complement RCT findings |
| Transparent reporting of eligibility criteria | Allows readers to judge applicability to their patient populations |
Generalizability is a judgment, not a test. There is no single statistic that quantifies it: it requires substantive reasoning about whether the study population and conditions match those to which you want to apply the findings.
Summary Table: Bias at a Glance
| Bias Type | Direction of Effect | Study Design | Key Prevention |
| Selection bias | Any direction | All | Probability sampling, clear eligibility criteria |
| Attrition bias | Usually toward null or favorable | RCTs, cohorts | ITT analysis, minimize dropout, imputation |
| Survivorship bias | Toward favorable outcomes | Cohort, trials | Inception cohort design, survival analysis |
| Recall bias | Away from null (overestimation) | Case-control | Prospective data, objective records |
| Misclassification (non-differential) | Toward null | All | Validated instruments, biomarkers |
| Confounding | Any direction | Observational | Randomization (RCT), multivariable adjustment |
| Publication bias | Away from null | Meta-analyses | Trial registration, funnel plots |
| Berkson’s bias | Any direction | Case-control | Population-based controls |
| Healthy worker effect | Toward null (underestimation) | Occupational cohort | Internal reference group |
Frequently Asked Questions
Q1: What is the difference between bias and confounding?
Bias is a systematic error in how the study was conducted: in how participants were selected or data were collected. Confounding is a substantive distortion of the exposure–outcome relationship caused by a third variable that is associated with both. Both produce wrong answers, but they arise from different sources and require different solutions. Randomization eliminates confounding but does not eliminate measurement bias. Blinding reduces information bias but cannot control for confounding in observational designs.
Q2: Can a randomized controlled trial still have significant bias?
Yes. Randomization only addresses selection bias and confounding at baseline. RCTs remain vulnerable to attrition bias (differential dropout), performance bias (unequal co-interventions), detection bias (unblinded outcome assessment), and reporting bias (selective outcome reporting). The Cochrane Risk of Bias tool (RoB 2) systematically evaluates these domains for a reason: randomization is necessary but not sufficient for an unbiased trial.
Q3: How do I know if my observational study has residual confounding?
You cannot fully rule it out. You can reduce known confounding through design (restriction, matching) and analysis (multivariable regression, propensity scores), but unmeasured confounders always remain a threat. Sensitivity analyses: such as E-values, which quantify how strong an unmeasured confounder would need to be to explain away your result: are increasingly used to communicate residual confounding risk transparently.
Q4: Is a large sample size enough to overcome bias?
No. Increasing sample size reduces random error (improving precision) but has no effect on systematic error (bias). A very large biased study simply produces a very precise wrong answer. This is why methodological rigor in study design matters far more than sample size alone. The famous case of the 1936 Literary Digest poll: which predicted the wrong US presidential winner with 2.4 million responses: is a textbook illustration of this principle.
Q5: What is the difference between internal validity and external validity, and which should I prioritize?
Internal validity means the study correctly estimates the exposure–outcome relationship in the study population (freedom from bias and confounding). External validity means those findings apply to other populations and settings. Internal validity is a prerequisite: a biased finding is not worth generalizing. However, a highly internally valid study with extremely narrow eligibility criteria may have limited real-world usefulness. The pragmatic vs. explanatory trial distinction captures this trade-off. Researchers should design studies primarily for internal validity, then explicitly discuss generalizability limitations in their papers.
This article was originally published on September 11, 2023, and updated on April 16, 2026.