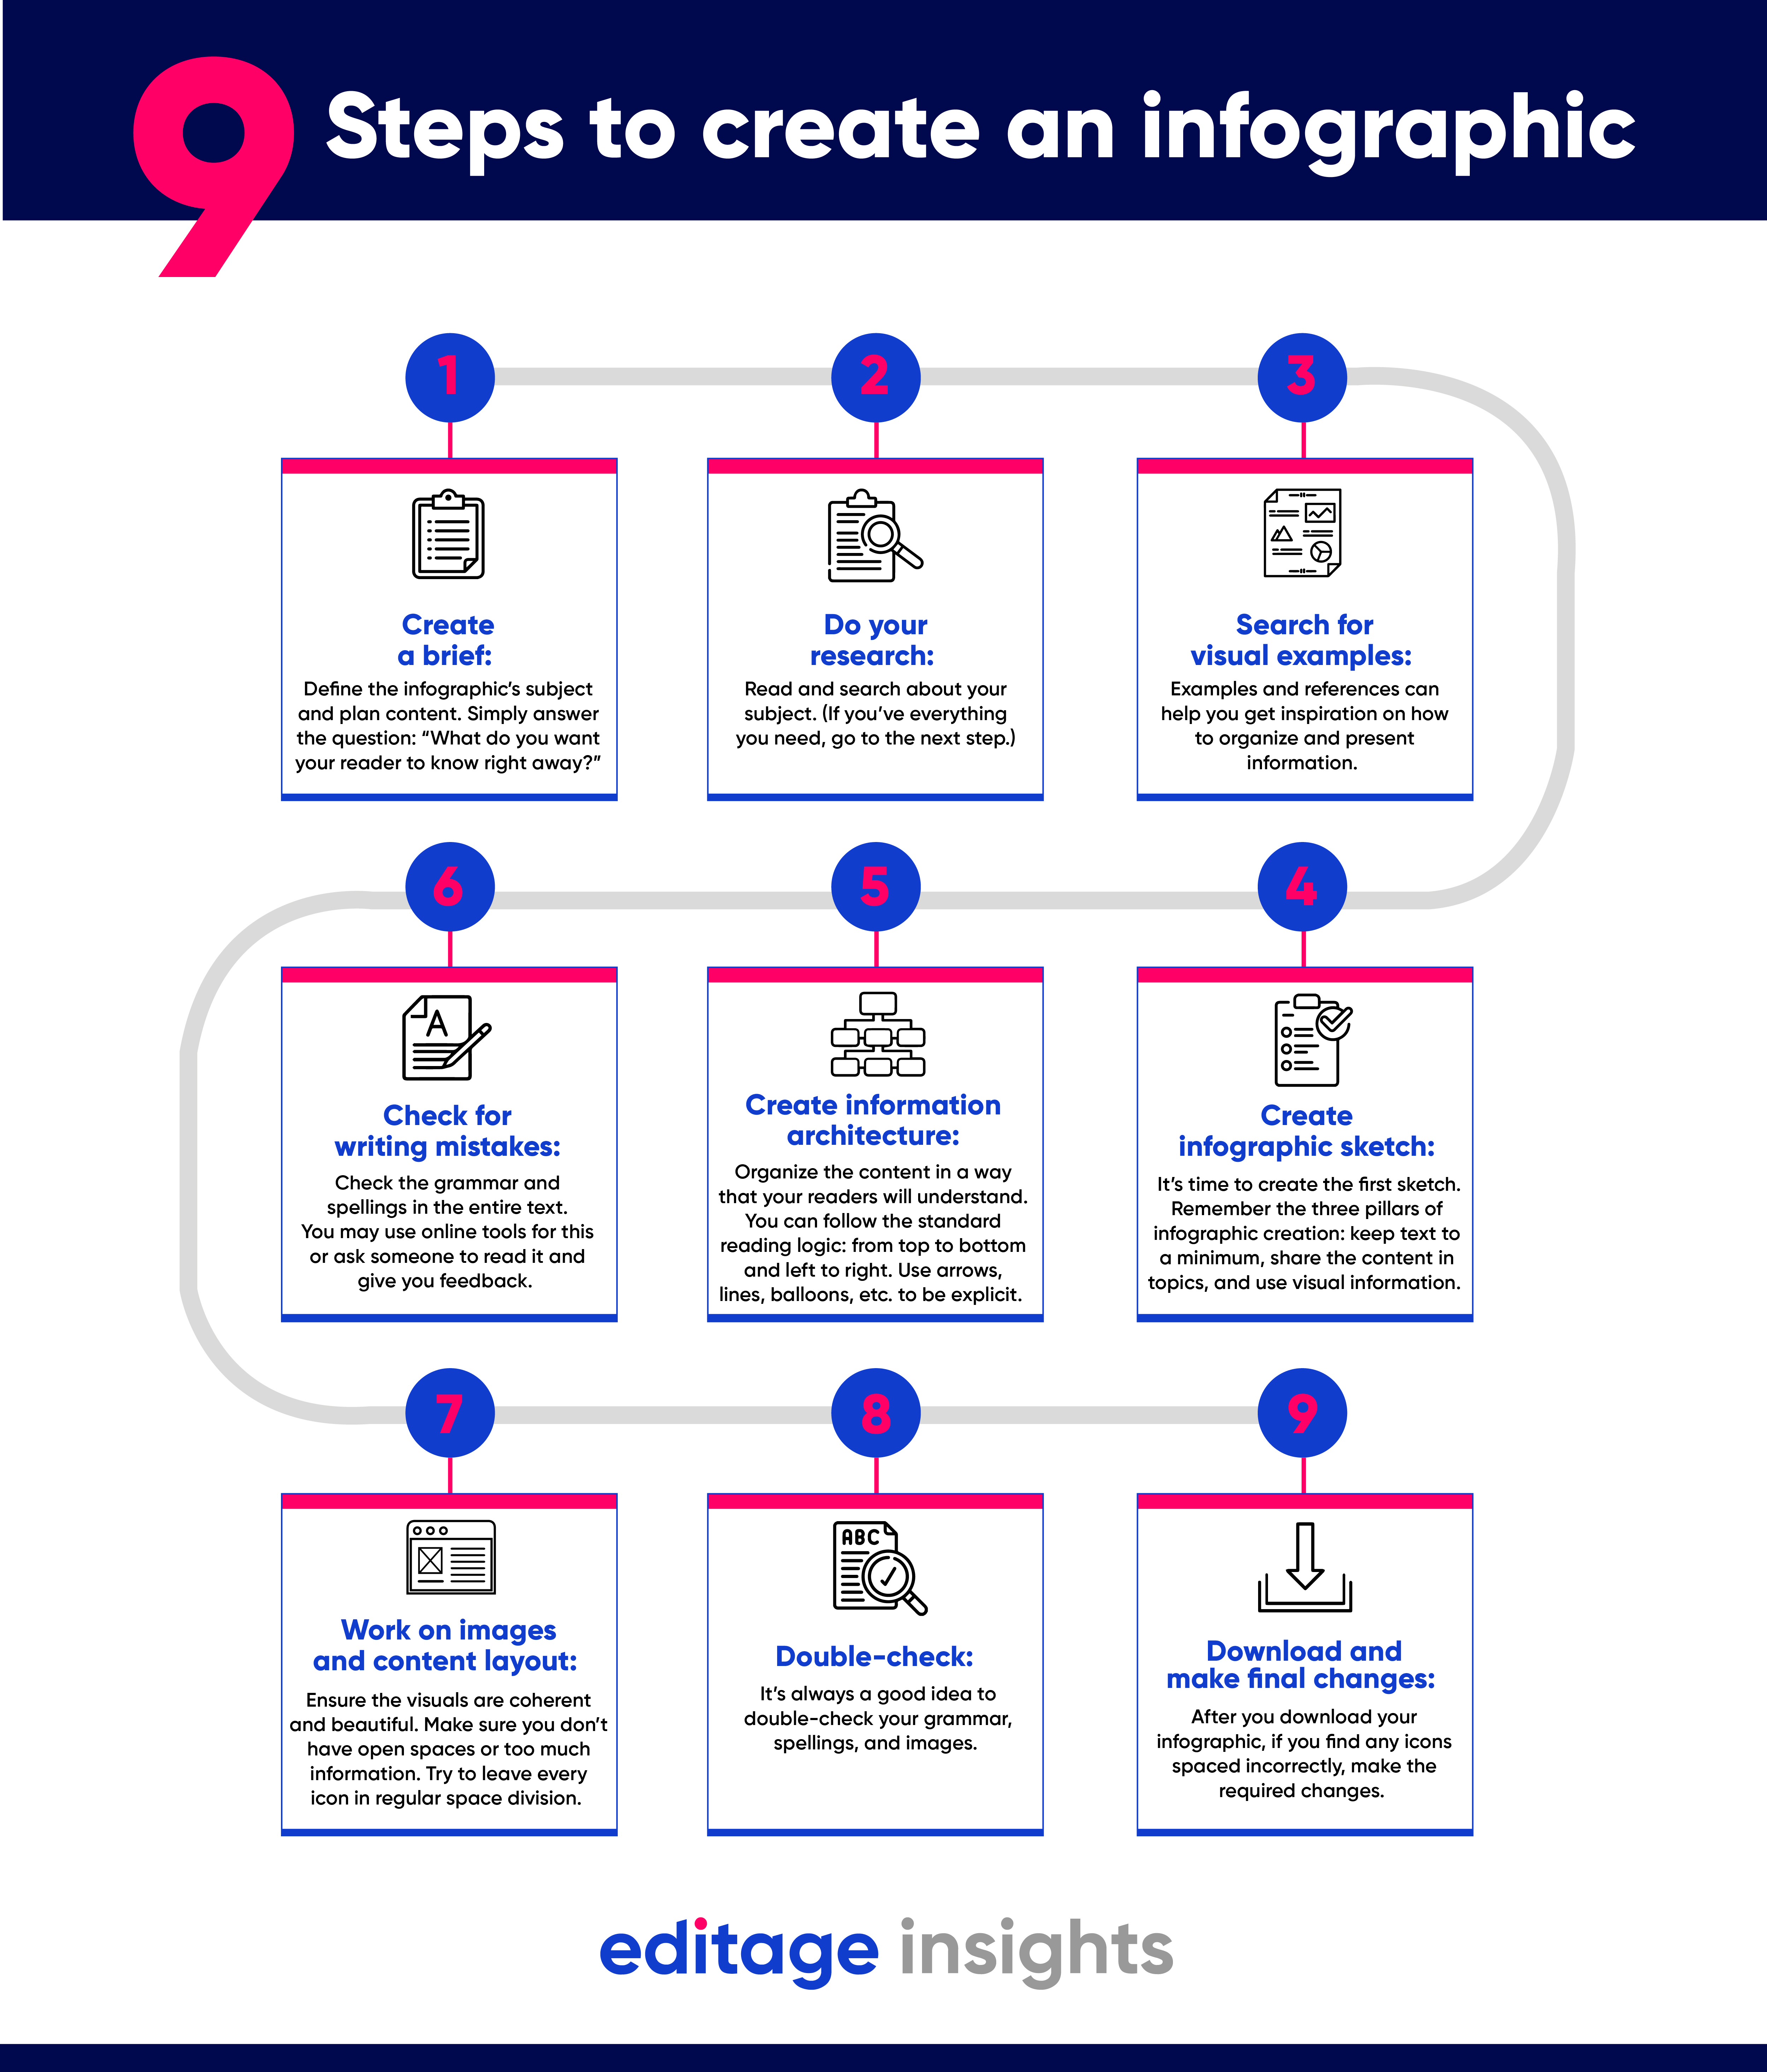
[Downloadable] 9 Steps to create an infographic for your manuscript
![[Downloadable] 9 Steps to create an infographic for your manuscript [Downloadable] 9 Steps to create an infographic for your manuscript](https://cdn.editage.com/insights/editagecom/production/styles/detail_page_image/public/presentation-1559937_960_720%20%281%29.png?itok=Qg4x2qkk)
Visual elements play a vital role in your research. They enable you to present complex data in a simplified manner that further allows readers to engage with your research. Powerful and comprehensible visuals also help you gain more visibility among funders and institutions, and gain more citations.
Interested in knowing how Infographics can be used in your research? Join our latest webinar: Use of Infographics in Scientific Communication: Is there a role for AI on this?
Here’s a downloadable visual guide by Mind the Graph, a free online platform that allows you to create beautiful infographics in a few simple steps.

Download it now!
MTG_Steps to create an infographic_0.png
You're looking to give wings to your academic career and publication journey. We like that!
Why don't we give you complete access! Create a free account and get unlimited access to all resources & a vibrant researcher community.

This content belongs to the Conducting Research Stage


View Comments